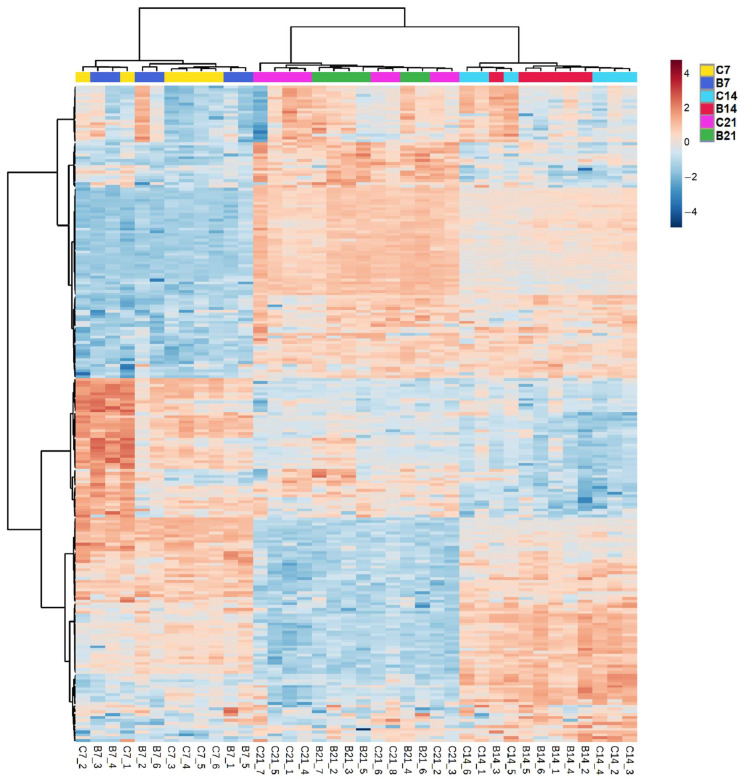
Figure 3.
Hierarchical clustering coupled with heatmap of the lipid profiles of Azospirillum-inoculated (B) and non-inoculated roots (C) of Brachypodium harvested at 7, 14, and 21 DAI. The lettering at the bottom of the heatmap indicates the replicates: for each replicate, blue and red colors indicate the lower or higher abundance of specific lipids compared to the other replicates, with darker colors indicating more pronounced differences.

