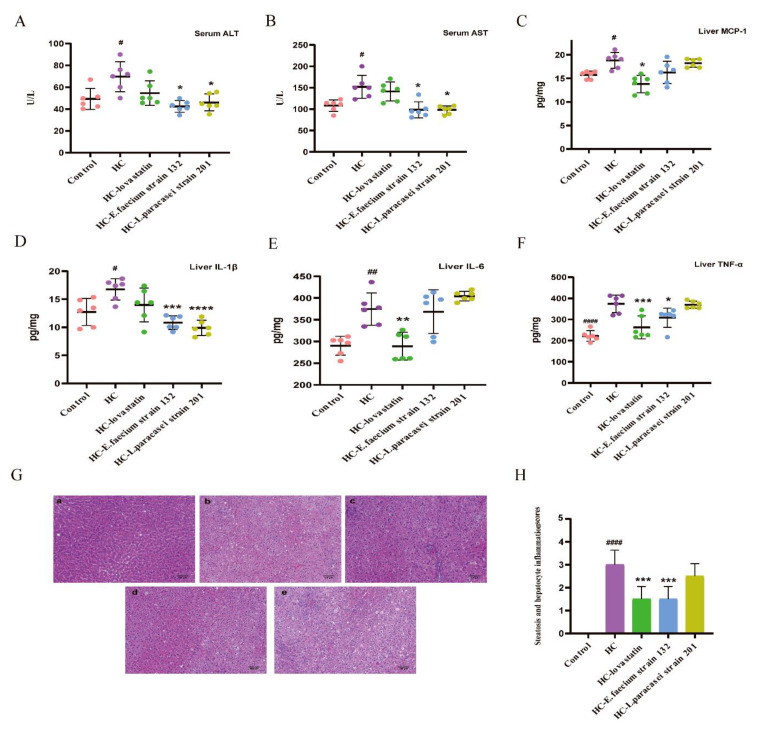
Figure 2.
Screening strains improved liver injury in hypercholesterolemia rats. (A) The level of serum glutamic pyruvic transaminase (ALT). (B) The level of serum glutamic oxalacetic transaminase (AST). (C) The level of liver monocyte chemotactic protein-1 (MCP-1). (D) The level of liver interleukin-1β (IL-1β). (E) The level of liver interleukin-6 (IL-6). (F) The level of liver tumor necrosis factor-α (TNF-α). (G) Hematoxylin-eosin (H&E) staining of liver; (a) control group, (b) HC group, (c) HC-lovastatin group, (d) HC-E. faecium strain 132 group, (e) HC-L. paracasei strain 201 group. (H) Steatosis and hepatocyte inflammation scores. p-values were determined using a one-way ANOVA with Tukey’s test for post-hoc analysis, n = 6. Significant differences between the HC group versus control group are indicated as # p < 0.05, ## p < 0.01, #### p < 0.0001. Significant differences in the HC-lovastatin, HC-E. faecium strain 132 or HC-L. paracasei strain 201 group versus HC group are indicated as * p < 0.05, ** p < 0.01, *** p < 0.001, **** p < 0.0001.

