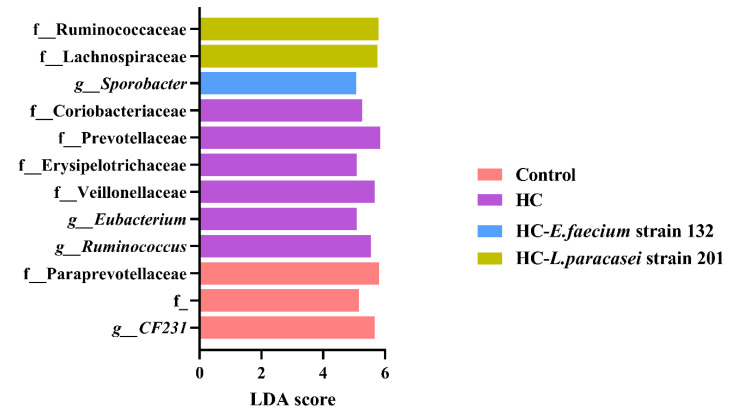
Figure 7.
Linear discriminant analysis (LDA) and effect quantity (LEfSe) were used to compare the microflora distribution among groups. LDA score > 4, FDR value < 0.1. The pink bar represents the control group, the purple bar represents the HC group, the blue bar represents the HC-E. faecium strain 132 group and the yellowish-brown bar represents the HC-L. paracasei strain 201group.

