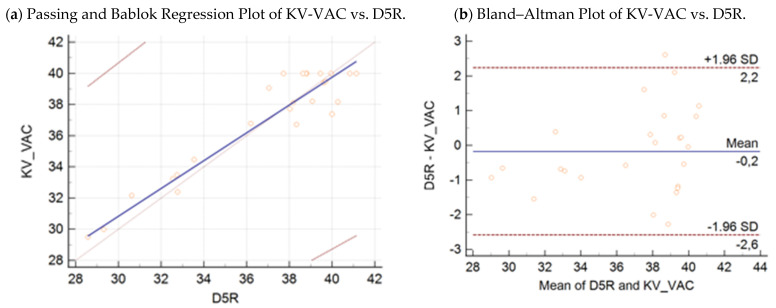
Figure 5.
(a) Passing–Bablok regression plot: comparison of Ct values obtained with the KV-VAC strain assay vs. Capripox-specific real-time PCR D5R assay, with 95% CI in 25 samples. (b) Bland–Altman plot: comparison of Ct values obtained with the KV-VAC strain assay vs. Capripox-specific real-time PCR D5R assay, with 95% CI in 25 samples.

