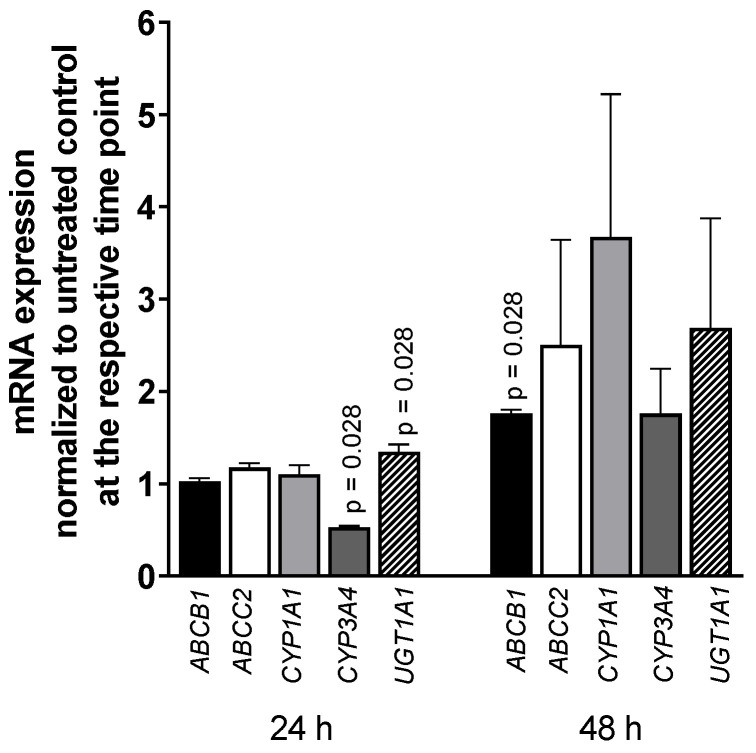
Figure 3.
mRNA expression levels of selected drug disposition genes in LS180 cells after treatment with 5000 U/mL IFN-α 2a for 24 h or 48 h. mRNA expression levels of exposed samples were normalized to expression levels of untreated control samples. Data shown are the mean ± S.E.M. of four independent experiments with technical duplicates for each compound, gene, or time point, respectively. Significant differences between drug-treated samples and corresponding controls were evaluated by an unpaired, nonparametric, two-sided Mann–Whitney U-test. p values < 0.05 were considered significant.

