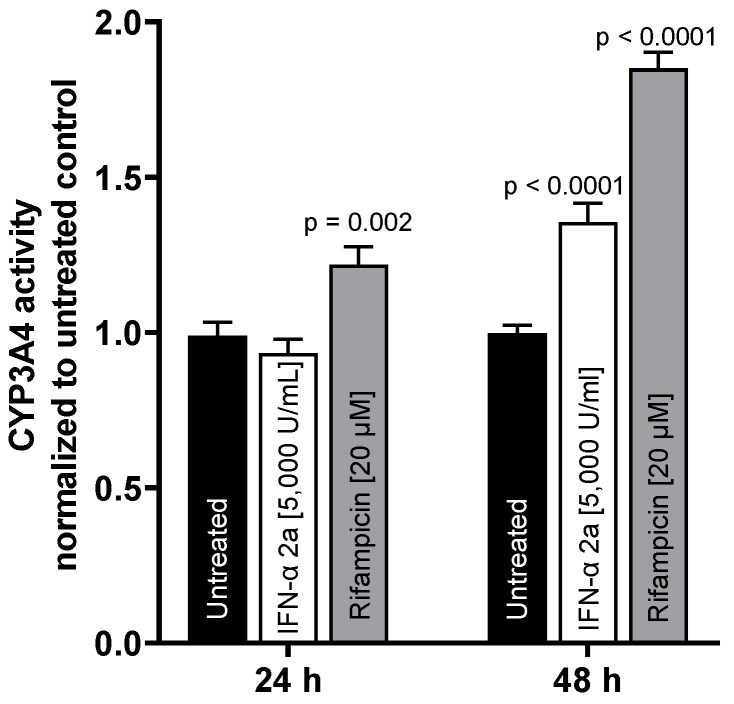
Figure 4.
CYP3A4 metabolic activity in LS180 cells after exposure to 5000 U/mL IFN-α 2a (white bars) or 20 µM rifampicin (gray bars) for 24 h or 48 h, respectively. Luminescence values of drug-treated samples were normalized to luminescence of untreated control samples (black bars). Data shown are the mean ± S.E.M. of three independent experiments with 6–7 technical replicates each. Statistical significance was evaluated using a two-way ANOVA with Dunnetts’s multiple comparison test, comparing drug-treated samples to control samples. p values < 0.05 were considered significant.

