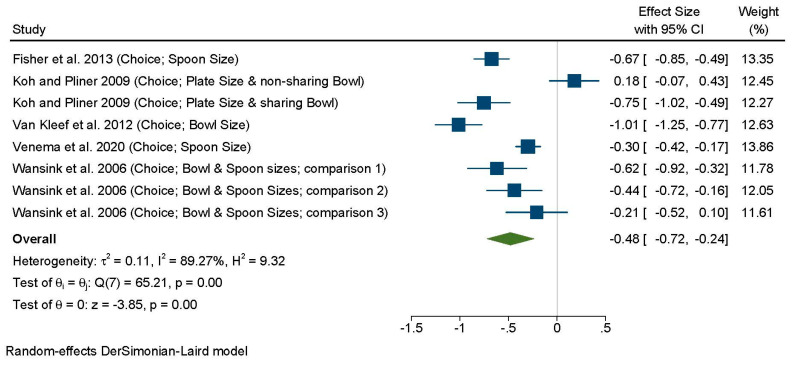
Figure 4.
Forest plot for the analysis of all comparisons examining the effects of portion control tools on portion size choice (served amount) using random-effects meta-analysis. Contributing comparisons are represented by a filled square with horizontal lines, where the area of the square depicts the contribution of the study to the full analysis, and the horizontal lines indicate the 95% CIs for each study. Studies displaced to the left of a 0 line demonstrate a finding in favor of the portion control tool to reduce serving sizes, whereas those to the right demonstrate a finding in favor of the portion control tool promoting an increase on served amounts when compared with the control condition. The diamond at the base of the plot represents the combined effect (Standardized Mean Difference) with 95% CIs. Wansink et al. 2006 Comparison 1—Small bowl combined with small spoon vs. Large bowl combined with large spoon. Wansink et al. 2006 Comparison 2—Small bowl combined with large spoon vs. Large bowl combined with large spoon. Wansink et al. 2006 Comparison 3—Large bowl combined with small spoon vs. Large bowl combined with large spoon.

