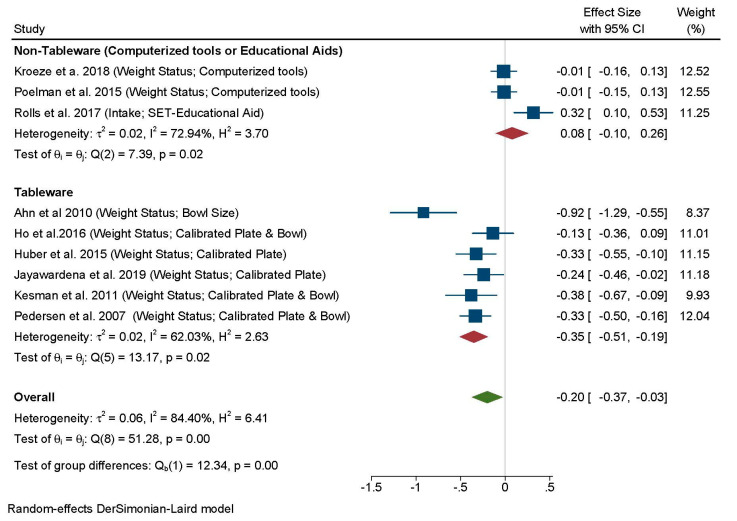
Figure 6.
Forest plot for the analysis of all comparisons examining the effects of portion control tools on weight status (weight loss or BMI change) using random-effects meta-analysis. Contributing comparisons are represented by a filled square with horizontal lines, where the area of the square depicts the contribution of the study to the full analysis, and the horizontal lines indicate the 95% CIs for each study. Studies displaced to the left of a 0 line demonstrate a finding in favor of the portion control tool helping to reduce body weight, whereas those to the right demonstrate a finding in favor of the tool to promote a higher BMI or weight gain, when compared with the control condition. The diamond at the base of the plot represents the combined effect (Standardized Mean Difference) with 95% Cis.

