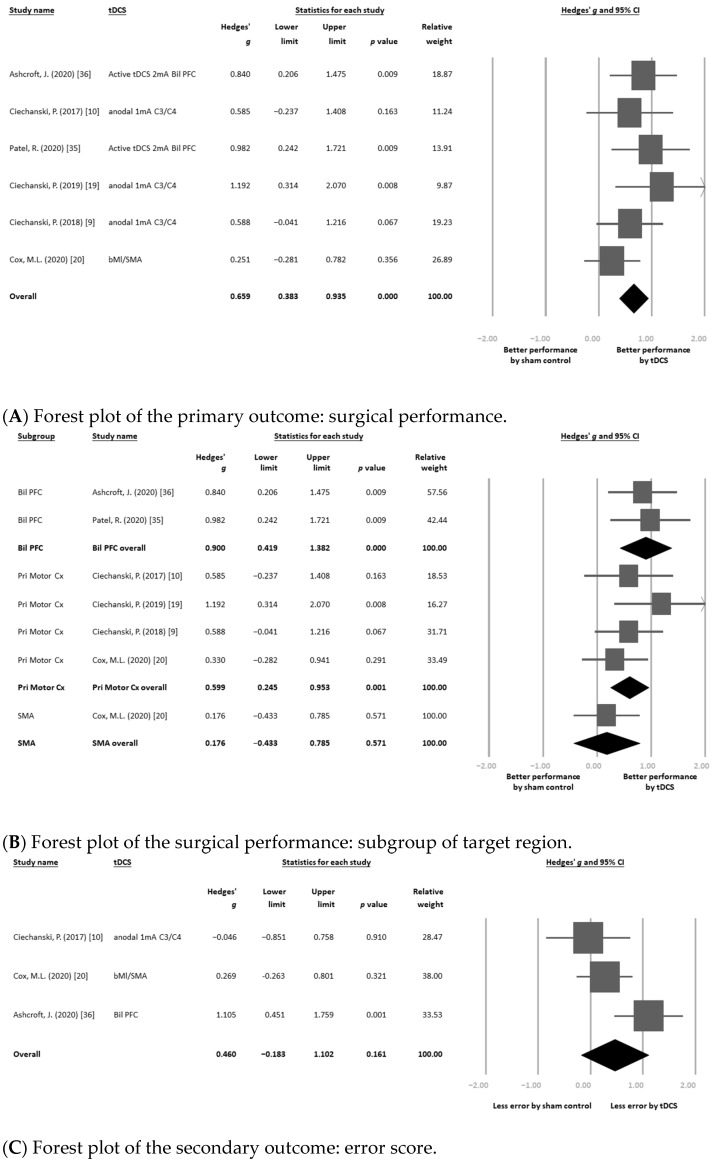
Figure 2.
Forest plots of (A) the primary outcome: surgical performance; (B) surgical performance: subgroup of target region; (C) the secondary outcome: error score; (D) error score: subgroup of target region; and (E) the safety profile: rate of local discomfort. The bold rows were the overall statistical results of each subgroups.


