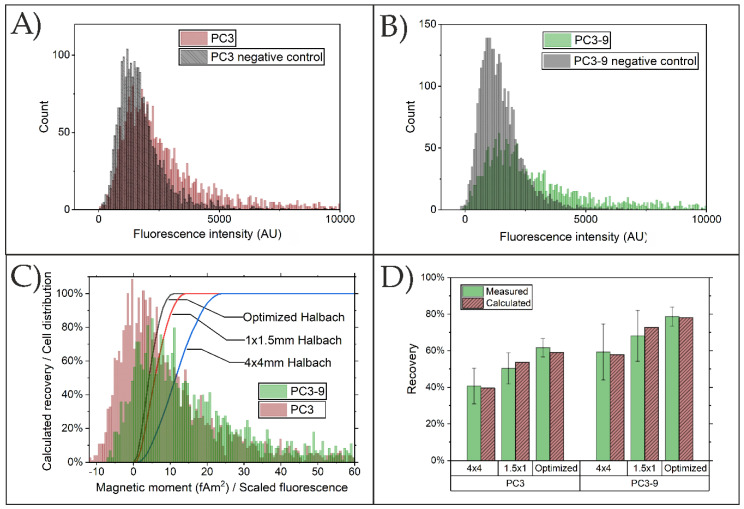
Figure 11.
Fluorescence intensity of ferrofluid bound to (A) PC3; (B); PC3-9, showing clear overlap with negative control. (C) Combination of calculated recoveries and scaled ferrofluid distribution at best fit with experimental data. (D) Measured recoveries compared to recoveries calculated using the scaled distributions.

