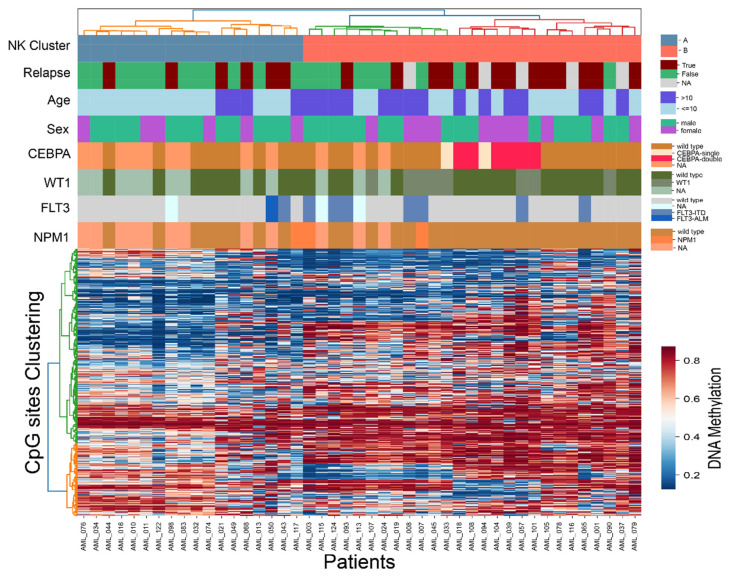
Figure 3.
Heatmap and hierarchical clustering of the 45 NK samples across 1300 CpG sites, including 30 cytogenetically defined (diagnostic-known) patients and 15 DNA methylation predicted NK patients. Each row in the heatmap denotes a CpG site and each column is a patient. The labels at the top of the heatmap represent clinical and molecular features of interest, including the Cluster denotation A and B.

