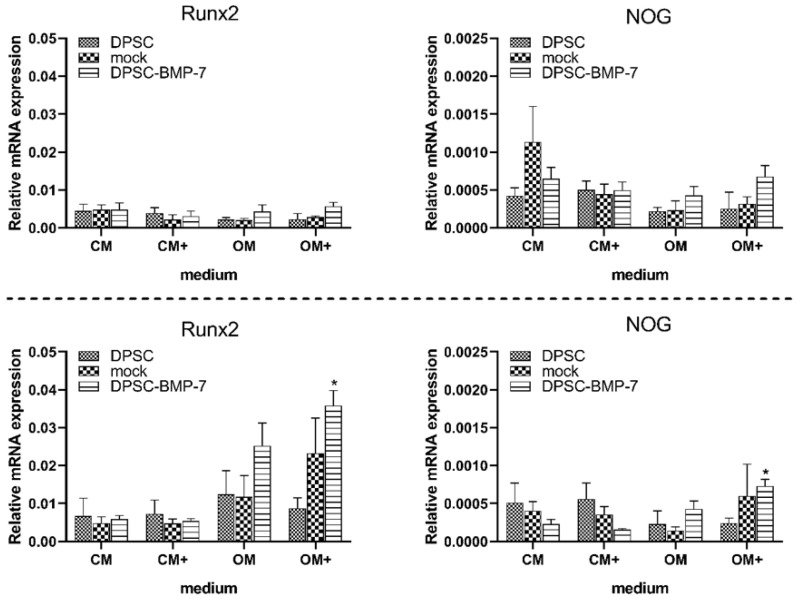
Figure 3.
Expression level of Runx2 and noggin (NOG) mRNA in case of the indicated cell lines. After 1 week (above) and 3 weeks (below) of induction in different media (mean ± SD; n = 3). *, p ˂ 0.05 vs. control (DPSC) in the same media, #, p ˂ 0.05 vs. untreated (CM or OM respectively) group of the same cell line.

