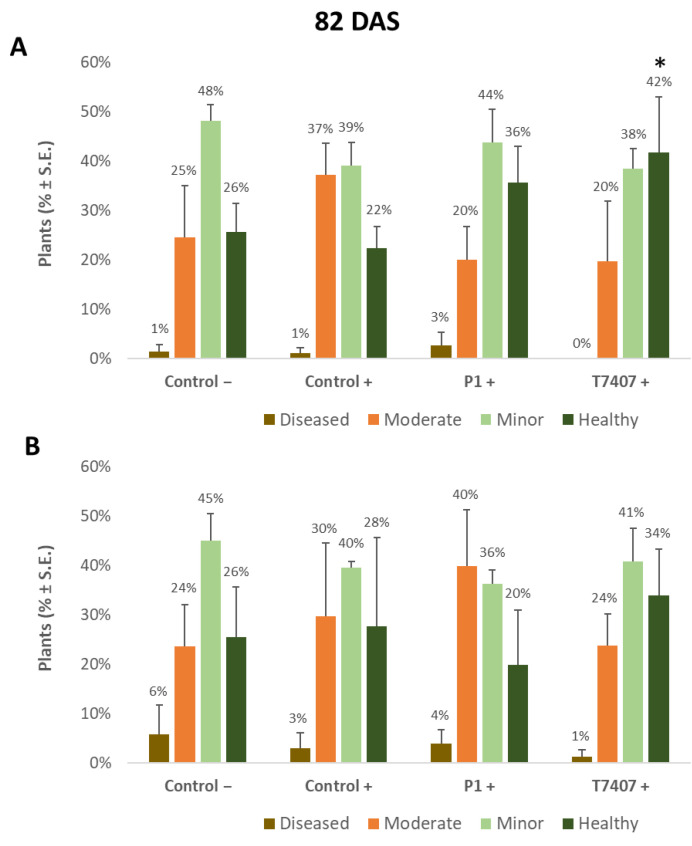
Figure 4.
Quantitative evaluation of lower stem disease symptoms at the end of the 2020 field experiment (82 DAS, 33 days after fertilization, DAF). (A). Stabbing-free treatments. (B). Stabbing inoculation treatments. Categories are described in Figure 2. The experimental treatments and controls are depicted in Figure 3. Values are calculated based on 61–158 plants in each treatment in at least two repeats. Deviation bars represent standard error. No statistical difference between the treatments or the treatments and the controls could be identified using the one-way ANOVA test. Yet, a one-tailed t-test compared to the infected control (a more powerful test) revealed significant differences (p < 0.05), indicated by an asterisk (*).

