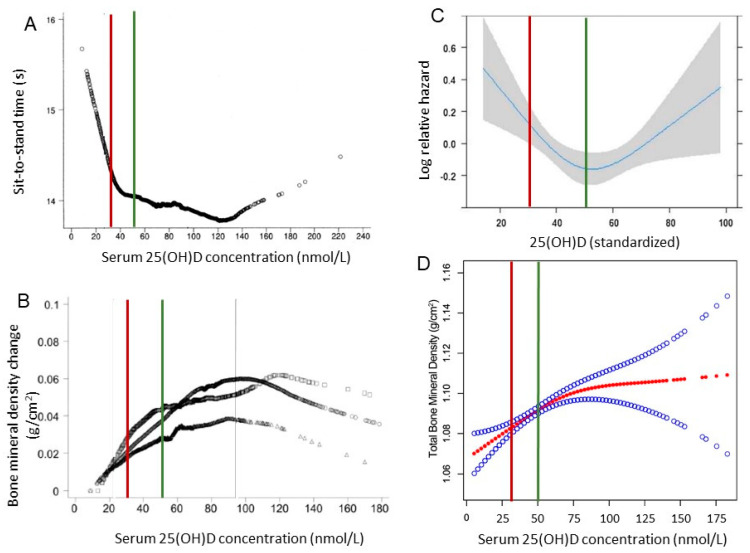
Figure 1.
Serum 25(OH)D concentration relationship with different structural or functional outcomes. (A). Serum 25(OH)D concentrations relationship with sit-to-stand time in adults with mean age 71 years (49% female) controlled for sex, age (5-year categories), race/ethnicity, BMI, poverty income ratio, daily calcium intake, number of medical comorbidities, use of a walking device, self-reported arthritis, activity level, and month of vitamin D measurement. From [47]. (B). Serum 25(OH)D concentration relationship with bone mineral density in adults ≥50 years after adjustment for sex, age, BMI, smoking, calcium intake, estrogen use, month of vitamin D measurement, and poverty income ratio. From [47]. (C). Spline curve describing the association between 25(OH)D concentration and recurrent fallers in the total population. From [49]. (D). The association between serum 25(OH)D level and total bone mineral density from NHANES 2001–2006 among 5990 adolescents (12–19 years). Solid red line represents the smooth curve fit between variables. Blue band represents the 95% confidence interval from the fit. Adjusted for age, gender, race/ethnicity, income to poverty ratio, education, physical activity, body mass index, calcium use. From [50]. Vertical line indicates vitamin D deficiency cutoff, i.e., serum 25(OH)D < 30 nmol/L (red), used in setting DRI [46] and insufficiency cutoff, i.e., serum 25(OH)D < 50 nmol/L (green), used in updating DRI [26].

