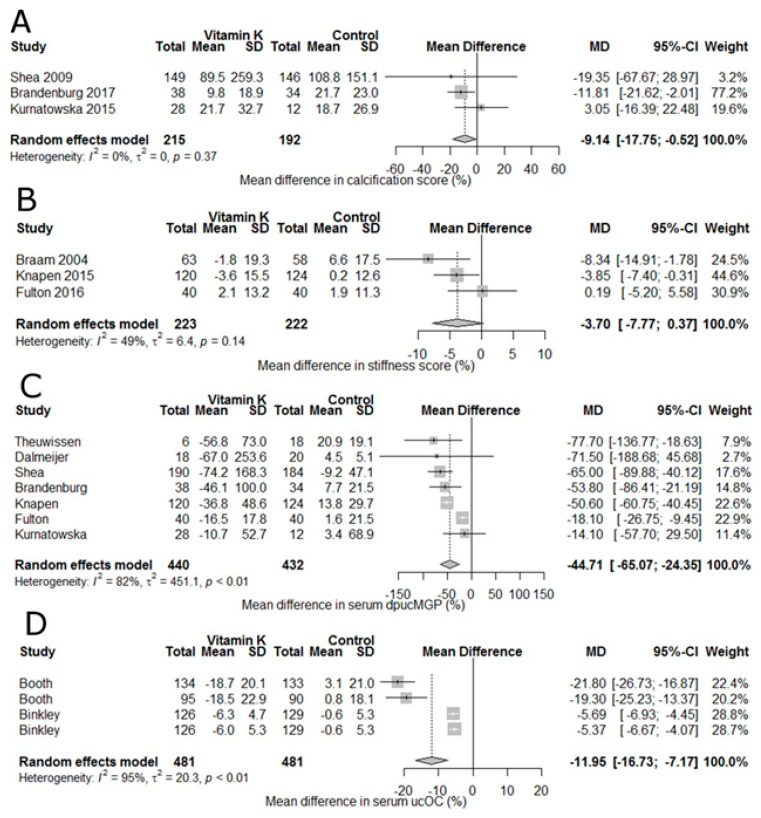
Figure 5.
Forest plots showing the effect of vitamin K supplementation。 (A) % change in vascular calcification. (B) Vascular stiffness. (C) Serum dephospho-uncarboxylated matrix Gla protein (dp-ucMGP). (D) serum uncarboxylated osteocalcin (ucOC). Data are presented as mean % difference and 95% CI. From [168].

