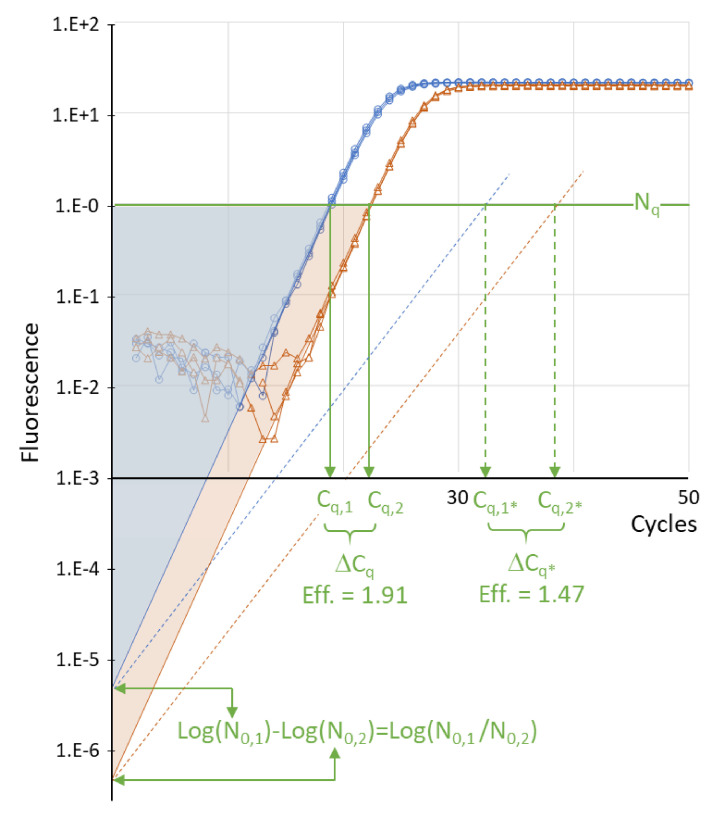
Figure 1.
Definition of Cq and ΔCq. When amplification curves are plotted on a logarithmic fluorescence axis, the exponential phase, with a constant PCR efficiency, can be identified as the cycles where the fluorescence values are on a straight line (solid lines; Eff. = 1.91). The intercept of the downward extrapolated line with the Y-axis is the fluorescence associated with the starting concentration (N0). Setting a quantification threshold (Nq, horizontal green line) is used to determine the Cq value, defined as the number of amplification cycles needed to reach the threshold (vertical green arrows). The uniform blue and orange triangles, from N0 to Nq to Cq, illustrate that for two sets of reactions with about 10-fold different starting concentrations and the same PCR efficiency; the difference in Cq values is proportional to the difference in log(N0). Therefore, the difference in Cq values (ΔCq = Cq,1 - Cq,2) is proportional to the log of the starting concentration ratio (log(N0,2/N0,1). The dotted lines illustrate that the same ratio of N0 values and an assay with a lower PCR efficiency (Eff. = 1.47) lead to higher Cq values (Cq,1* and Cq,2*) and a larger ΔCq*. The graph is based on actual amplification data; the dotted lines represent a hypothetical less efficient assay.

