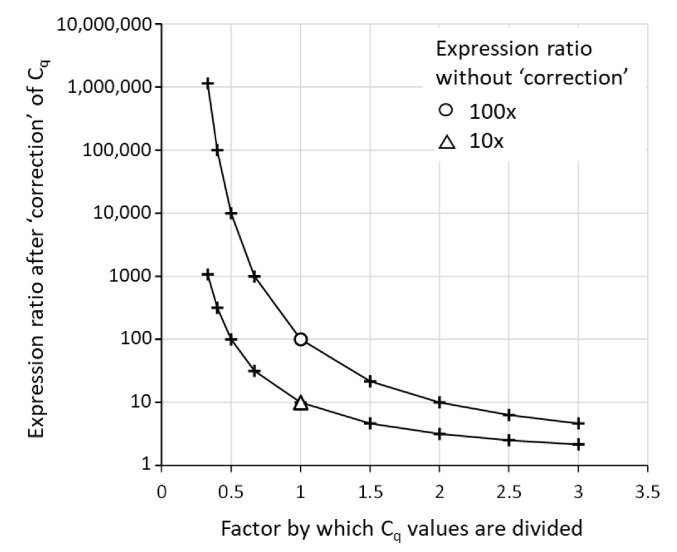
Figure 2.
Incorrect use of Cq for removal of between-plate variation. Some methods to remove between-plate variation are erroneously based on dividing the Cq values on a plate by a factor per plate. The graph is based on hypothetical samples with three true expression levels (N0 values = 10, 100 and 1000) measured on nine plates with between-plate differences ranging from 0.33 times down to 3 times up. The measured expression levels were converted into Cq values, divided by the factor per plate and re-converted into “corrected” expression levels. Between-plate correction should preserve the expression ratios on each of the plates in the experiment. Therefore, the 100- and 10-fold ratio between the highest and the middle N0 (circle) and the highest and the lowest N0 (triangle), should not be preserved. The graph shows that dividing Cq values will lead to distortion of expression ratios.

