Figure 7.
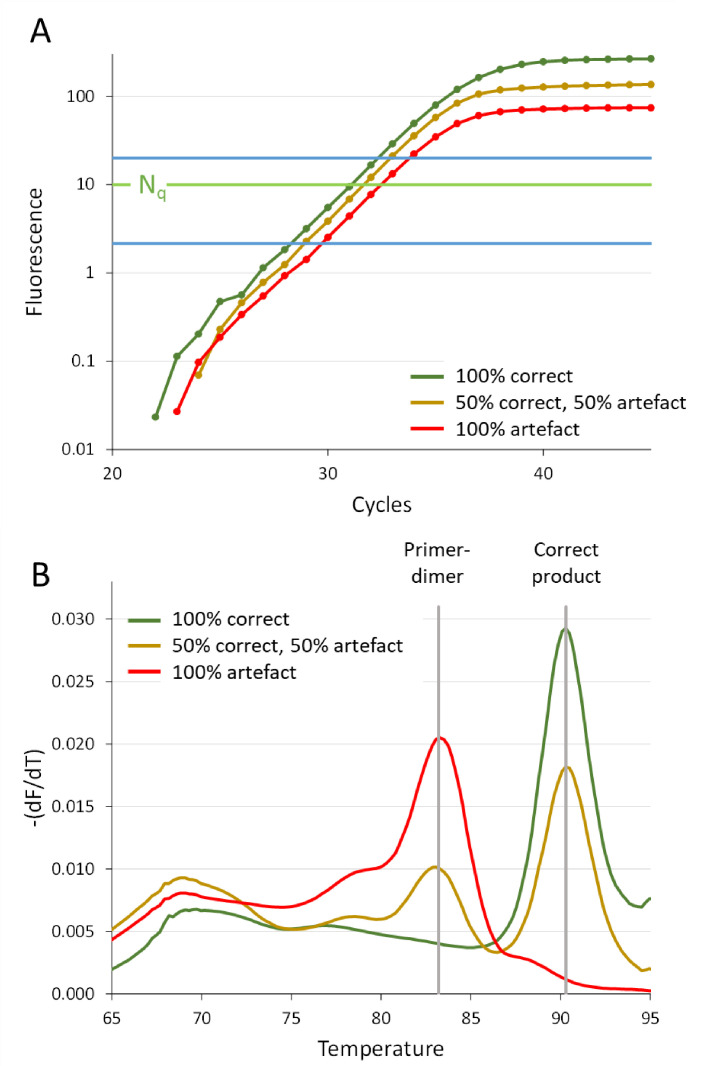
Amplification of correct target and artefact. Different mixtures of intended correct target and primer-dimer artefact were prepared from isolated products and amplified with PCR using the same primer pair for all reactions [11]. (A) Amplification curves showing that the PCR efficiency, determined from the selection of data points in the window of linearity (blue lines [23]), is the same for the correct target, the mixture and the artefact [12]. The difference in plateau level reflects the different lengths of the PCR products. (B) Graph of the negative first derivative of the melting curves (−dF/dT) reflects the composition of the mixtures that were amplified. The vertical grey lines indicate the melting temperatures of the correct product (90.3 °C) and the primer-dimer artefact (83.2 °C). The presence of the different products in the three reactions illustrates that the observed Cq values (panel A, Nq) are correct (green amplification curve), too low (brown curve) or artificial (red curve). The graphs are based on actual amplification data [11].

