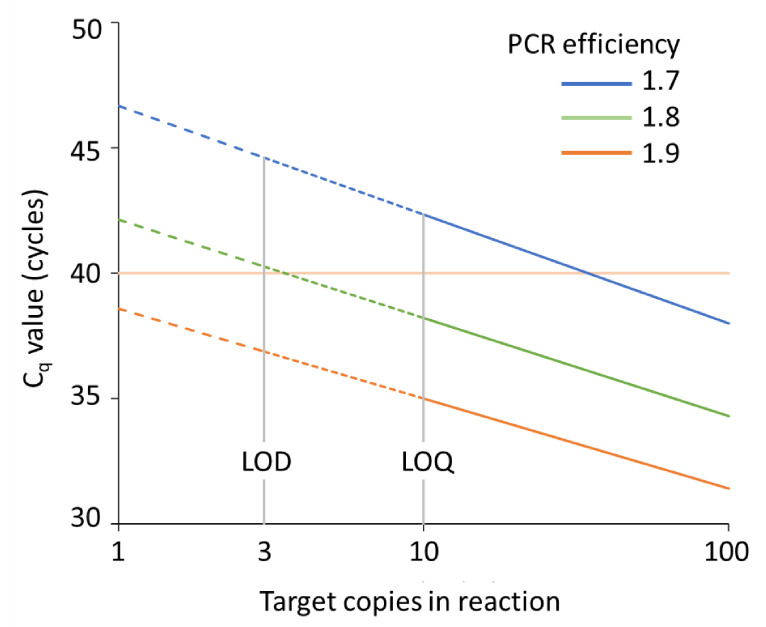
Figure 8.
Illustration of the Cq values observed for different inputs and efficiency values. The graph shows the observed Cq values for different numbers of target copies in the reaction for PCR efficiency values of 1.7, 1.8 and 1.9. The Poisson variation (see Figure 6) means that for inputs below 10 copies the PCR cannot be used for quantitative analysis (dotted lines, LOQ), whereas below three copies even the qualitative (yes/no) conclusion becomes unreliable (dashed lines, LOD; see Section 9.1). However, the graph illustrates that the relation between Cq values and LOQ and LOD depends on the PCR efficiency. The MIQE guidelines [2] indicate that the use of an arbitrary cut-off for accepting Cq values as valid at, e.g., 40 cycles (pink line), may be either too low (eliminating valid results when the PCR efficiency is low) or too high (increasing unreliable positive results). The graph is based on the kinetic equation of PCR (Equation (1)).

