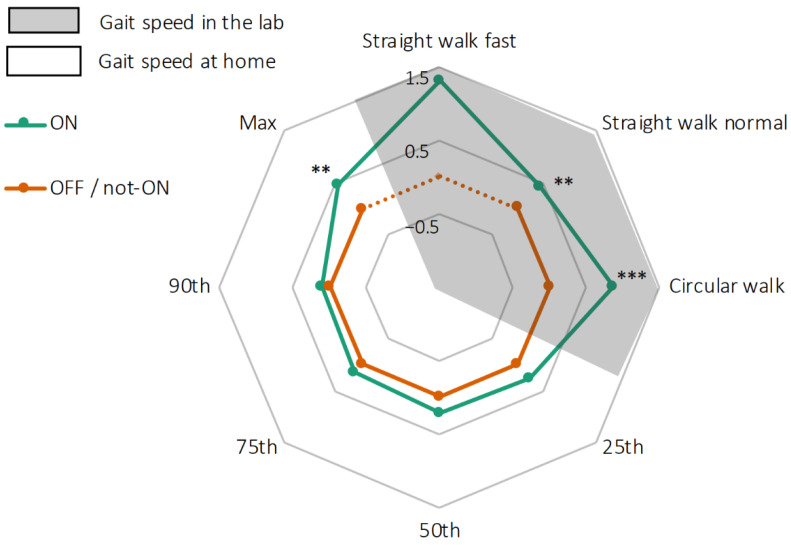
Figure 3.
Radar plot illustrating gait speeds of 27 PD patients during lab tests (in grey) and in their domestic environment (white, presented by different percentiles). Gait speeds during medication OFF in the lab and not-ON in the domestic environment are presented as 0 (orange line), and gait speeds during medication ON are presented as deviation from 0 (green line). Straight walking test at fast pace was not performed during OFF medication state (dotted orange line). ** p < 0.01, *** p < 0.001.

