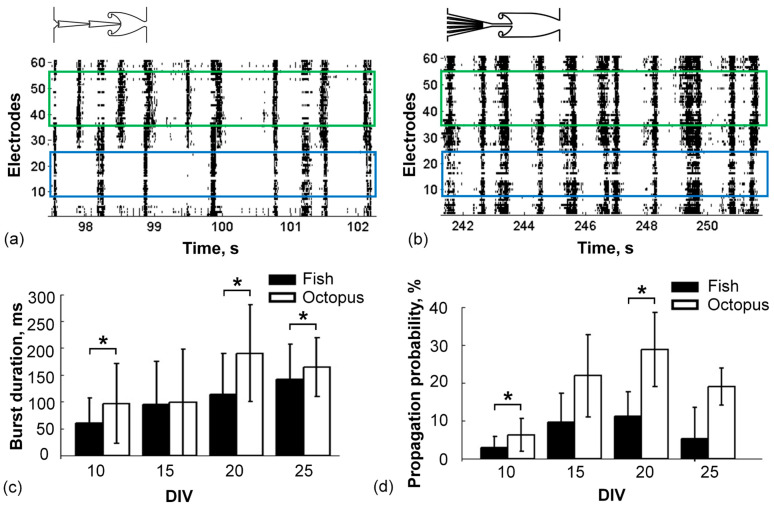
Figure 2.
Propagation of spontaneous bursts between modules in two types of microchannels. (a) Raster plot of the activity in the Fish chip (see Methods for details). Some of the bursts propagated from the Source to the Target module. A blue box indicates the Source module, green box—the Target module. (b) Raster plot of the activity in the Octopus chip. Most of the bursts propagated from the Source to the Target module. (c) Mean (± standard deviation) burst durations recorded in the Source module of the Fish (black, n = 10 cultures) and the Octopus chip (white, n = 4 cultures) during culture development from 10 DIV to 25 DIV. (d) Probability of burst propagation from the Source to the Target module in the Fish and the Octopus chips. Mann–Whitney test, p < 0.05 (*).

