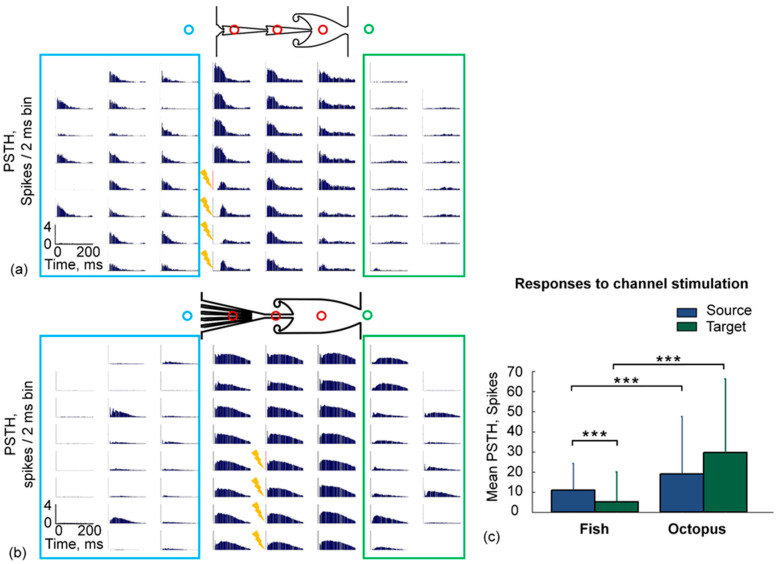
Figure 3.
Spiking patterns in response to low-frequency test stimulation applied to the axons in the microchannels. PSTH map of the responses induced by test stimulation (see Methods) of four electrodes in microchannels in Fish (a) and Octopus (b) chip. (c) The mean PSTH of responses in the Source and the Target modules to electrical stimulation of four microchannels. Mann–Whitney Rank Sum Test, p < 0.001 (***).

