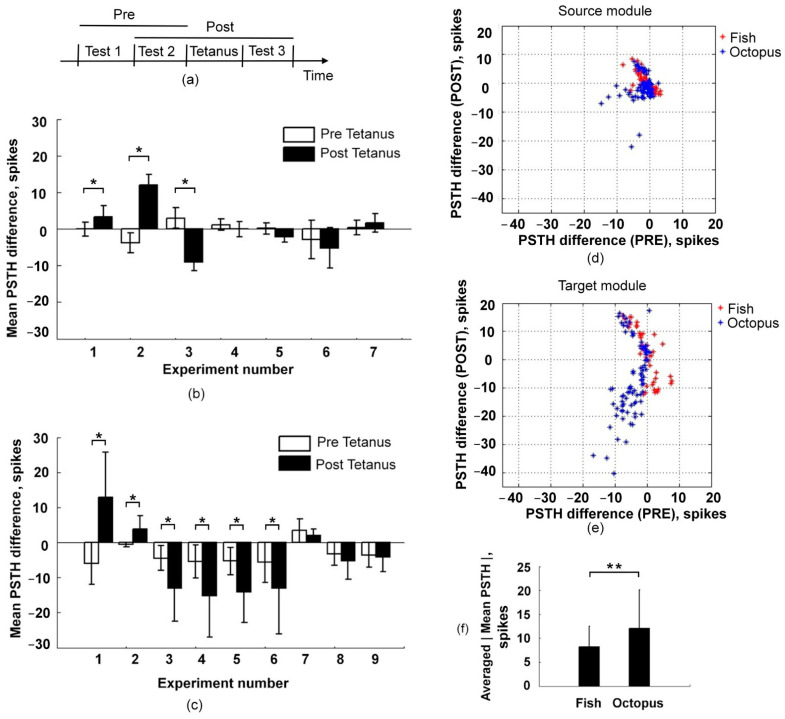
Figure 4.
Tetanus-induced changes in evoked responses. (a) Schematic illustration of the experimental protocol. (b,c) Mean of PSTHs difference of the responses in pre- (white bar) compared with the mean difference in post-tetanus (black bar) (see Methods) in Fish (n = 7 experiments, 3 cultures) (b) and Octopus chips (n = 9 experiments, 4 cultures) (c). Mann–Whitney Rank Sum Test, p < 0.05 (*). (d,e) Scatter plot of the PSTH difference in each electrode for pre- and post-tetanus of the Fish (red) and the Octopus (blue) chips for the Source (d) and the Target module (e). Only experiments with a significant effect of tetanization are shown. (f) The averaged absolute values of mean PSTH after tetanic stimulation (see Methods) of cultures in Fish (n = 3 experiments) and Octopus chips (n = 6 experiments). Mann–Whitney Rank Sum Test, p < 0.01 (**).

