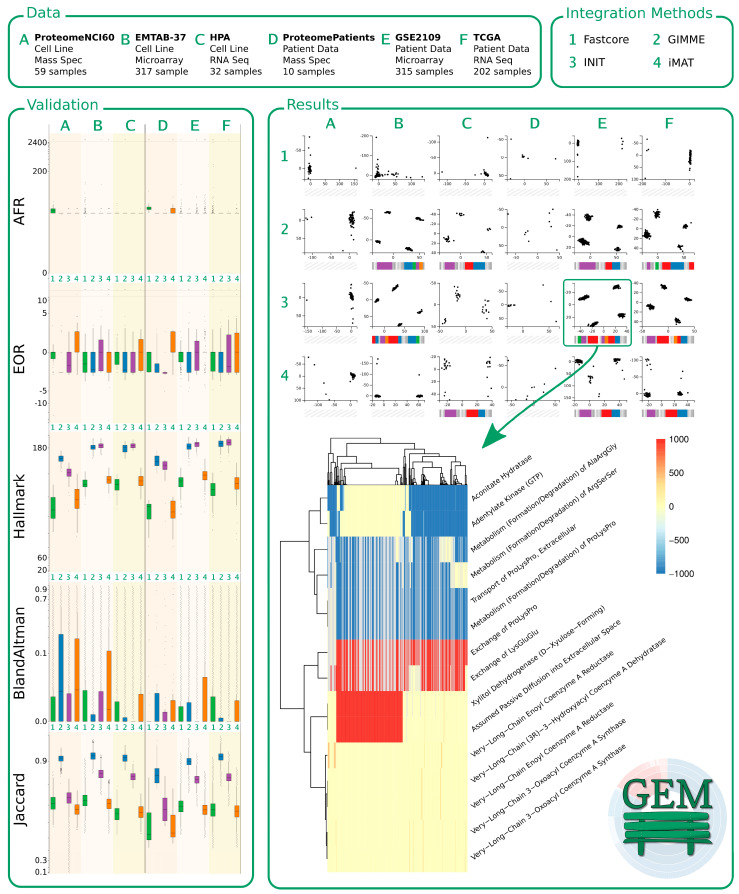
Figure 9.
Preview of the GEMbench website. The top of the figure shows some basic information regarding the data (A: NCI-60 Proteome, B: EMTAB-37, C: HPA, D: ProteomePatients, E: GSE2109, and F: TCGA) and integration methods (1: FASTCORE, 2: GIMME, 3: INIT, and 4: iMAT) used in this study. The panel on the left-hand side shows the results of validating our CGEMs. The panel on the right-hand side shows some of the results: at the top can be seen how we distinguished groups of samples using PCA and at the bottom, a corresponding heatmap indicates the results when analyzing the data of 3E (INIT applied to GSE2019) using random forests.

