
Figure 1.
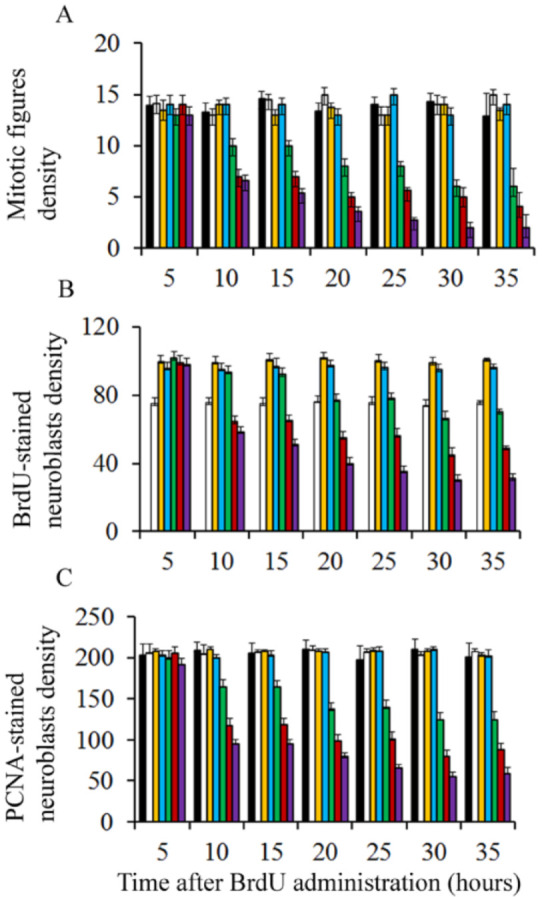
Mean values for mitotic figure (A), BrdU-reactive neuroblasts (B), and PCNA-stained cells density (C) in the cerebellar neuroepithelium of rodents injected with saline (black columns), 25 µg/g (white columns), 50 µg/g (yellow columns), 75 µg/g (blue columns), 100 µg/g (green columns), 200 µg/g (red columns), and 300 µg/g of BrdU (purple columns).