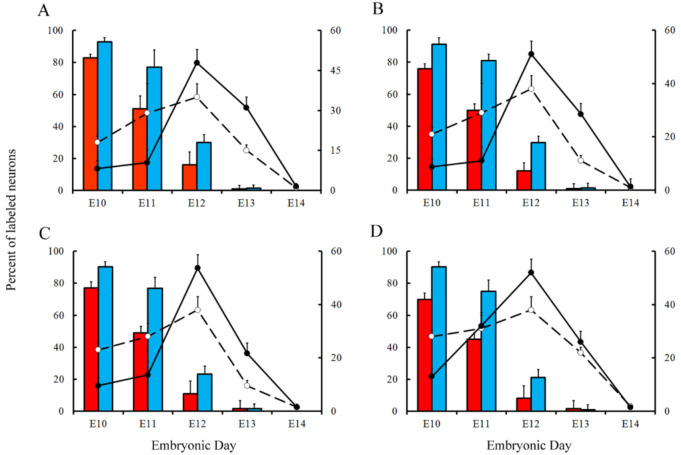
Figure 6.
Comparison of Purkinje cells neurogenetic patterns in animals injected with bromodeoxyuridine (red columns) or [3H]TdR (blue columns) at the level of the vermis (A), paravermis (B), medial (C), and lateral hemispheres (D). Developmental timetables of Purkinje cells were inferred using bromodeoxyuridine (open circles and dashed lines) or [3H]TdR (closed circles and solid black lines). E: embryonic day. Values are expressed as mean ± SEM.

