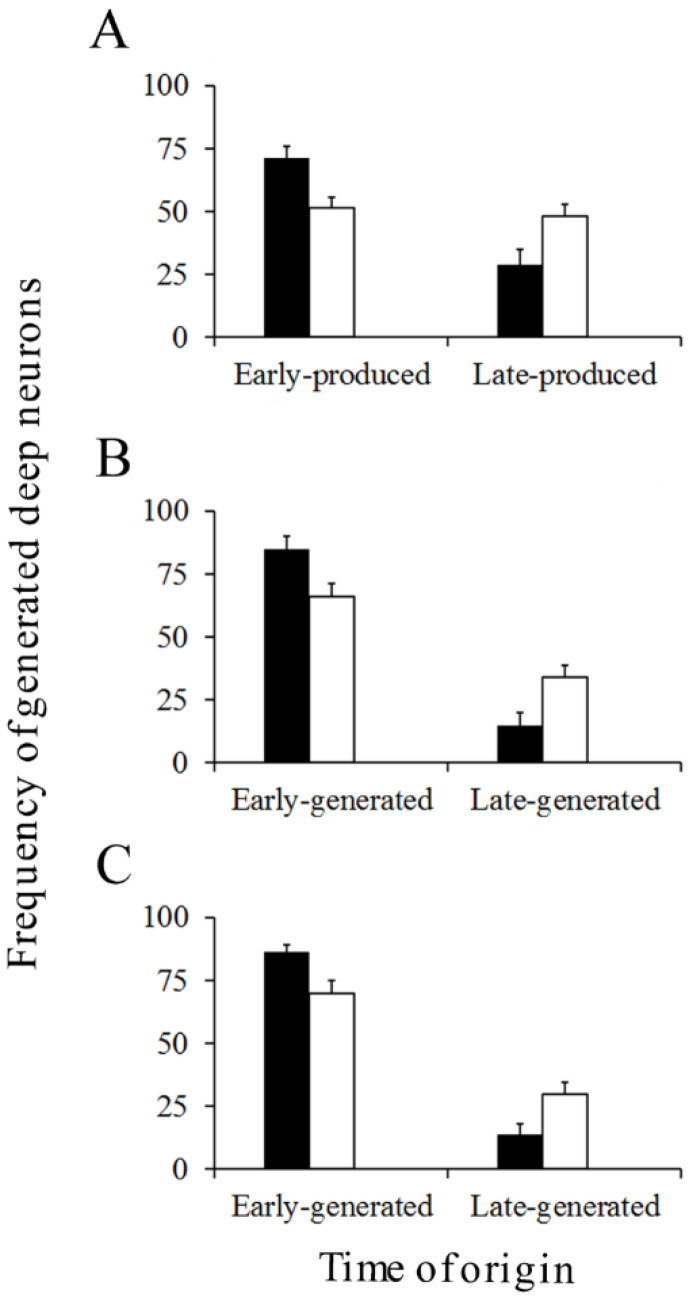
Figure 9.
Percentage of early and late-generated deep nuclei neurons scored at the level of the fastigial (A), interpositus (B), and dentate (C) nuclei. Black columns indicate animals injected with bromodeoxyuridine and white columns animals administered with [3H]TdR. Values are expressed as mean ± SEM.

