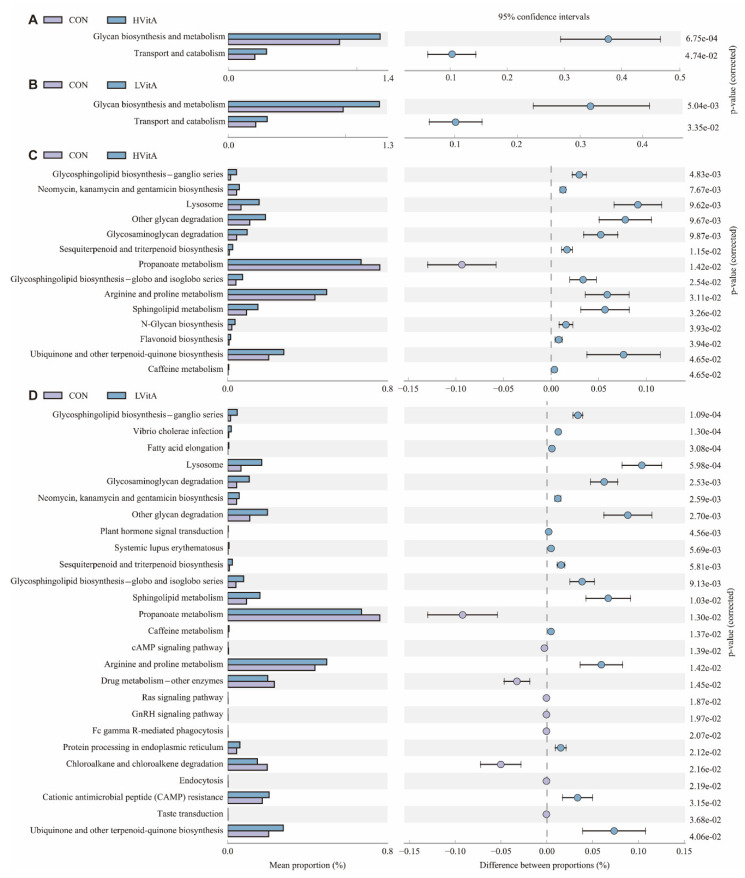
Figure 6.
Comparison of KEGG pathways predicted by PICRUSt according to diet. The differential analysis diagram of KEGG metabolic pathways between the CON and HVitA groups at levels 2 (A) and 3 (C) and the differential analysis diagram of KEGG metabolic pathways between the CON and LVitA groups at levels 2 (B) and 3 (D). CON group, vitamin A with 0 IU/kg of diet; LVitA group, vitamin A with 20,000 IU/kg of diet; HVitA group, vitamin A with 1,280,000 IU/kg of diet.

