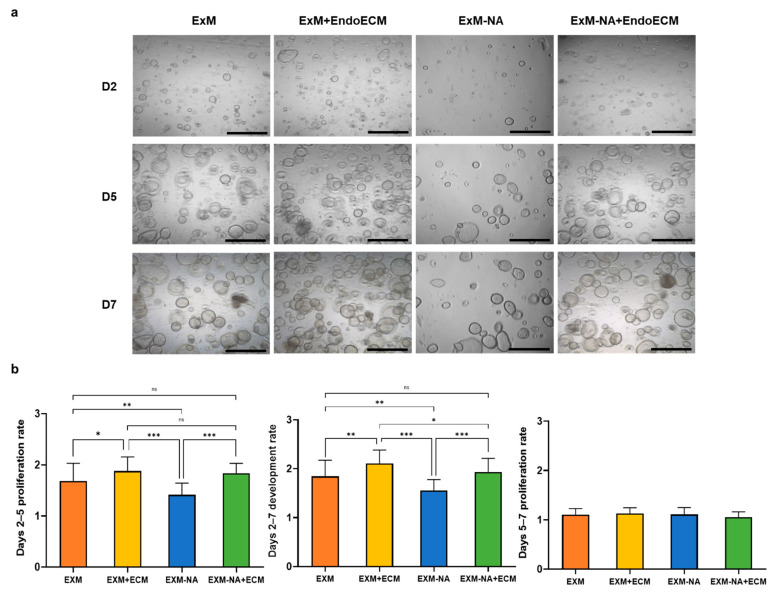
Figure 5.
Comparative proliferation of human endometrial organoids exposed to different conditions. (a) Representative images of endometrial organoids in all culture conditions: ExM, ExM+EndoECM, ExM-NA, ExM-NA+EndoECM. (b) Days 2–7, 2–5, and 5–7 proliferation rates. * p < 0.05, ** p < 0.001, *** p < 0.0001. Scale bars are 1 mm.

