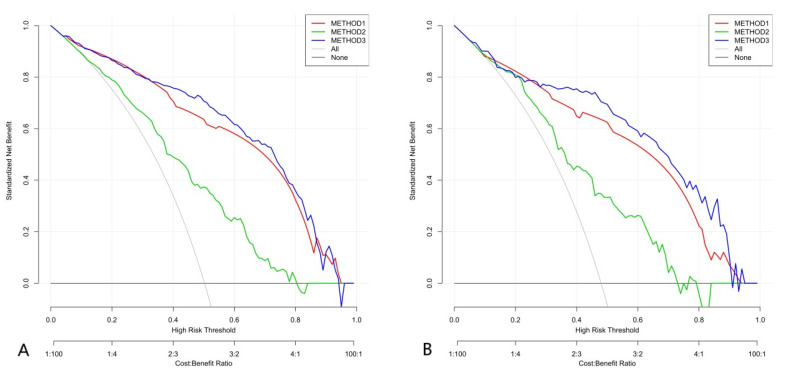
Figure 5.
Decision curve analysis (DCA) of three methods. Net benefit (y-axis) = true positive rate—(false positive rate × weighting factor), weighting factor = threshold probability/(1-threshold probability). The DCA showed that if the threshold probability was >about 25%, the method that combined the Rad-score and the five parameters of ACR TI-RADS to distinguish between benign and malignant TNs would be more beneficial for patients than the Rad-score or the five parameters of ACR TI-RADS alone. (A) Training group. (B) Verification group.

