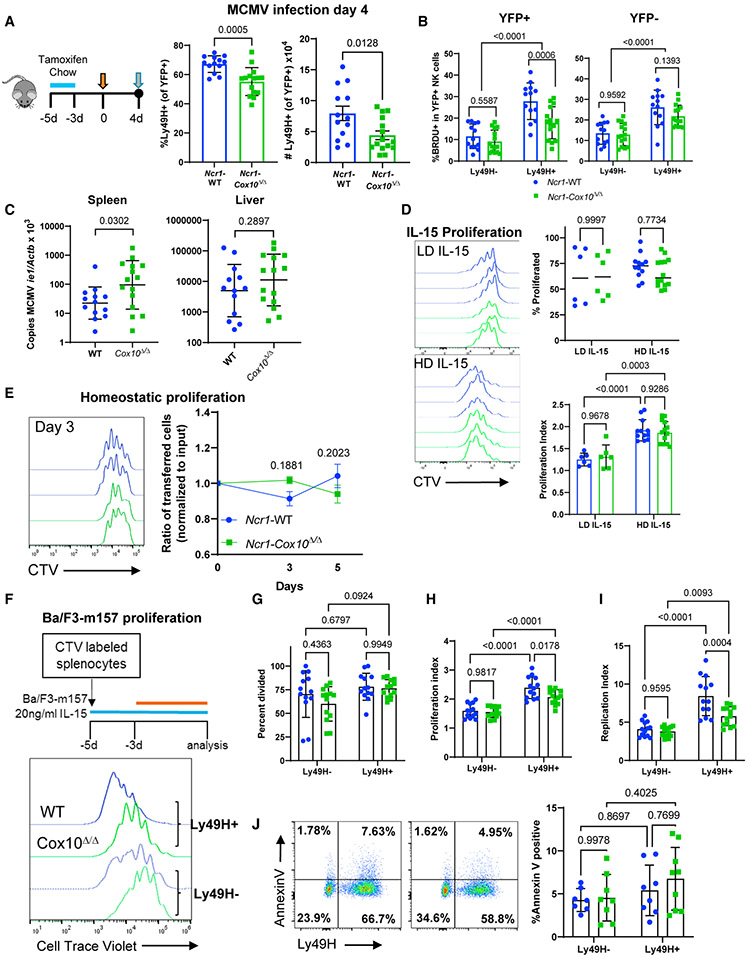
Figure 2. Cox10-deficient NK cells have impaired proliferation in response to activating ligand stimulation during MCMV infection.
(A–C) Female Ncr1-Cox10Δ/Δ and Ncr1-WT mice were infected with 5 × 10⁴ plaque-forming units (PFU) of MCMV and analyzed at day 4.
(A) The percentage and number of YFP+Ly49H+ NK cells were significantly lower in Ncr1-Cox10Δ/Δ mice.
(B) BrdU incorporation was lower in Ly49H+ NK cells lacking Cox10 (YFP+ Ly49H cells from Ncr1-Cox10Δ/Δ mice), demonstrating a defect in proliferation in antigen-specific NK cells.
(C) MCMV copy number normalized to β-actin was higher in Ncr1-Cox10Δ/Δ mice.
Data in (A)–(C) represent four separate experiments (individual mice are shown), analyzed using an unpaired t test for (A), a two-way ANOVA for (B), and an unpaired t test of log-transformed data for (C).
(D) NK cell proliferation following 3 days of IL-15 culture. Representative CTV histograms are shown for WT (blue) or Cox10-deficient (green) NK cells with low-dose IL-15 (LD, 5–10 ng/mL) or high-dose IL-15 (HD, 100 ng/mL). The percentage of proliferated cells was the same between the LD and HD groups. The proliferation index was the same between WT and Cox10-deficient cells and was higher with HD IL-15 compared to LD IL-15 (n = 6–14/group in four independent experiments, pooled data shown, two-way ANOVA).
(E) WT and Cox10-deficient NK cells were co-transferred into Rag2−/− γc−/− host mice, with similar ratios of cells recovered. (n = 2 hosts/group in three independent experiments, pooled data analyzed by two-way ANOVA).
(F) Ncr1-Cox10Δ/Δ and Ncr1-WT splenocytes cultured with IL-15 for 2 days followed by addition of Ba/F3-m157 cells for 3 days. Representative flow histograms of CTV for Ly49H+ and Ly49H− NK cells (all YFP+) are shown.
(G–I) There was no difference in percentage of cells that divided (G), but proliferation analysis demonstrated significantly reduced (H) proliferation index and (I) replication index in Ly49H+ Cox10-deficient NK cells compared to WT (two-way ANOVA, n = 13 mice/group in five independent experiments).
(J) Annexin V staining was similar, representative flow plots with WT on the left and Cox10-deficient on the right and pooled data shown (two-way ANOVA, n = 7–9 mice/group, three independent experiments). For all experiments, error bars represent mean and SD.

