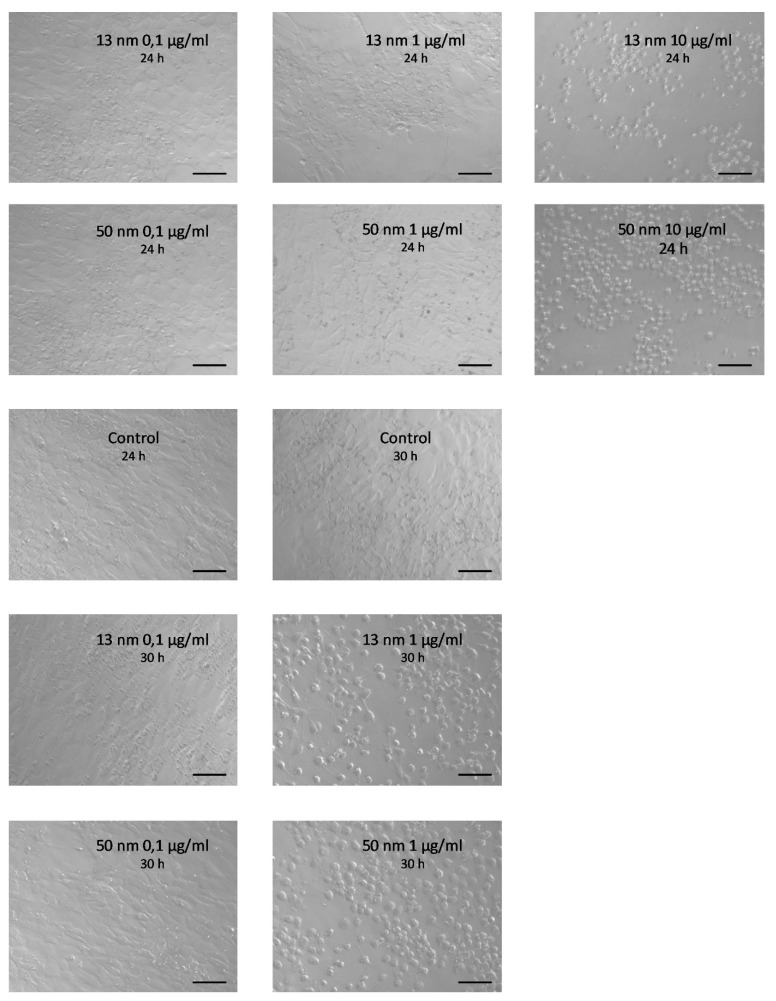
Figure 2.
Representative phase-contrast micrographs (taken with an Axio Observer from Zeiss, Germany) showing chicken granulosa cell culture derived from F2 preovulatory follicles with the addition of increased concentrations of 13 nm and 50 nm AgNPs taken after 24 h and 30 h of the incubation period. For better visualization of the difference between 1 µg/mL 13 nm AgNPs and 1 µg/mL 50 nm AgNPs after 30 h of incubation, see Supplementary materials. Scale bars = 50 µm.

