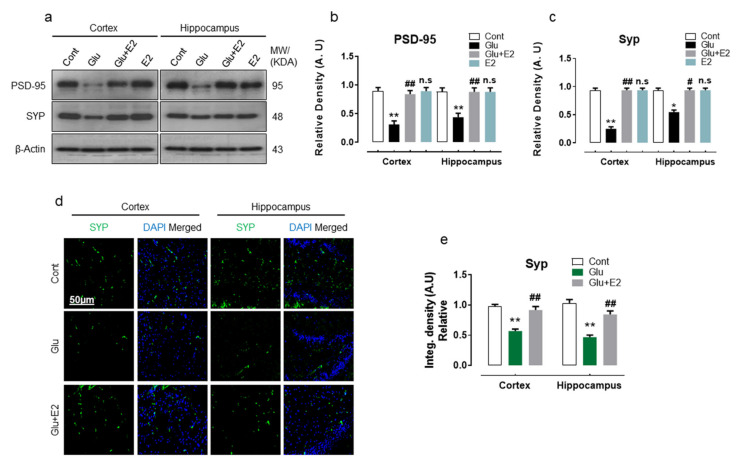
Figure 4.
17β-Estradiol inhibited synaptic dysfunction in postnatal day 7 rat brain. (a–c) Immunoblot with their respective histograms of PSD-95 and SYP in the cortex and hippocampus of postnatal rats group (n = 6 rats/group). Bands were quantified by ImageJ software; the differences were represented by a histogram. β-actin was used as a loading control. Statistical analysis was performed via one-way ANOVA. The density values are expressed in arbitrary units (A.U.) and mean ± S.E.M. for the respective indicated protein. (d,e) Immunofluorescence analysis of SYP (green) with respective histogram stained with DAPI (blue) within the cortex and hippocampal-DG region. The data are presented relative to control. Magnification 10×. Scale bar = 50 µm. Significance * p < 0.05, ** p < 0.01 vs control group and # p < 0.05, ## p < 0.01 vs glutamate-injected group. n.s = non-significant difference.

