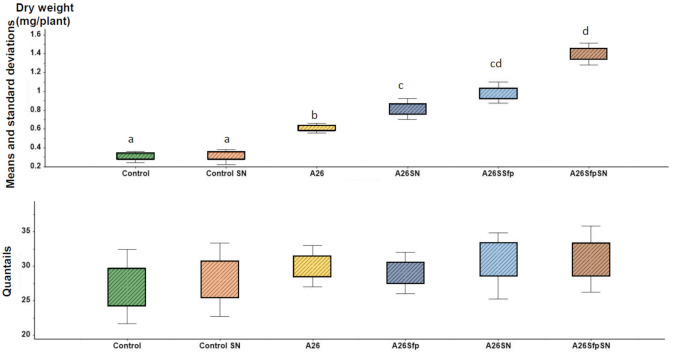
Figure 1.
Seedlings weight analysis in soil assay. Plant dry weight means and standard deviations along box plot skewness of seedlings treated with A26, A26SN, A26Sfp, or A26SfpSN. ANOVA univariate analysis was performed and post hoc LSD tests were used to identify treatments significantly different from control (p < 0.05). Different letters indicate statistically significant differences.

