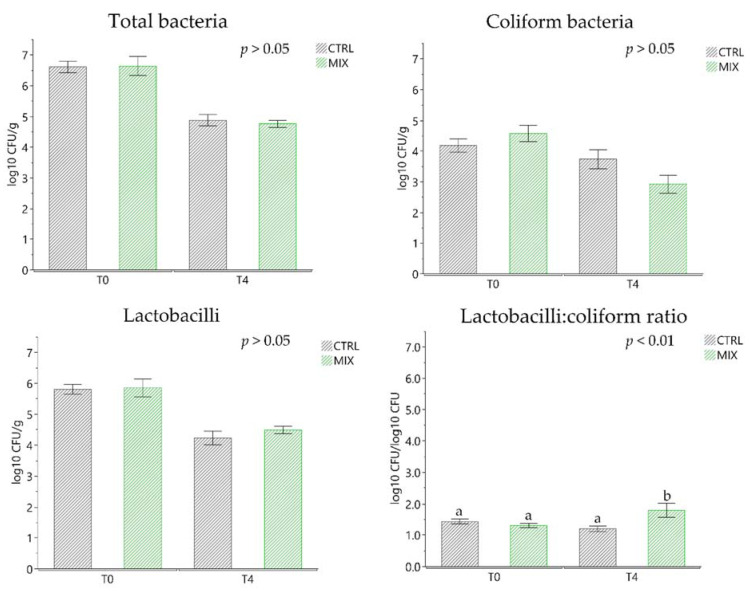
Figure 2.
Faecal content of the principal bacterial groups (total bacteria, coliform, lactobacilli and lactobacilli:coliform ratio) divided by control (CTRL) and treatment (MIX) at the beginning (T0) and after 28 days of trial (T4). a,b Means with different superscripts are significantly different between treatments (p < 0.05). Data are expressed as least square means (LSMEANS) and standard errors (SE). CTRL: control group; MIX: treatment group supplemented with 0.75% tannin extract, 0.25% leonardite and 0.20% tributyrin in the diet.

