Figure 8.
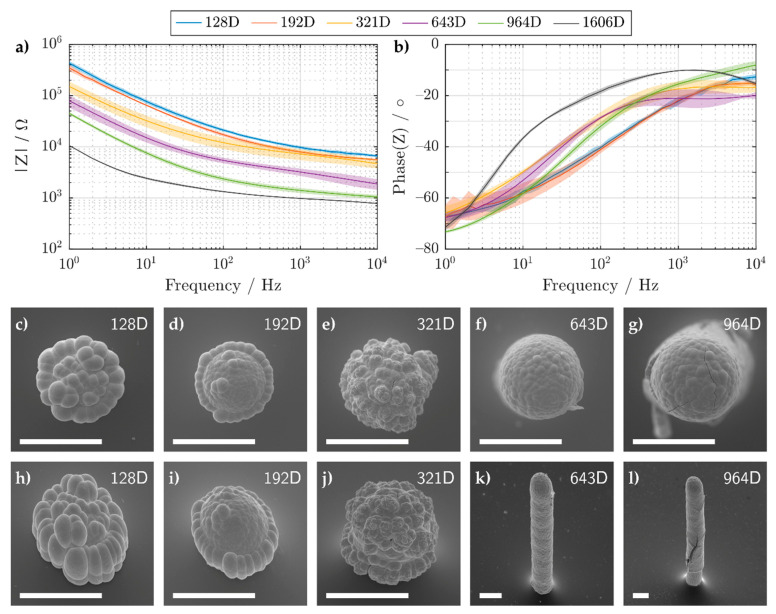
(a) Magnitude and (b) phase of the impedance of electroplated Ag-Au-Pt 3D microelectrodes, which were printed with different droplet numbers. The mean and standard deviation (solid line and shaded area, respectively) were calculated using 4 samples. (c–l) Tilt-corrected SEM images of the same 3D microelectrodes taken at a substrate tilt of (c–g) 0° and (h–l) 45°. All SEM images used an acceleration voltage of 15 kV. A magnification of (c–j) 1000×, (k) 350×, and (l) 250× was used. All scale bars shown have a length of 40 μm. The numbers in the legend and the upper right corner of the SEM images correspond to the amount of ejected Ag nanoparticle droplets.

