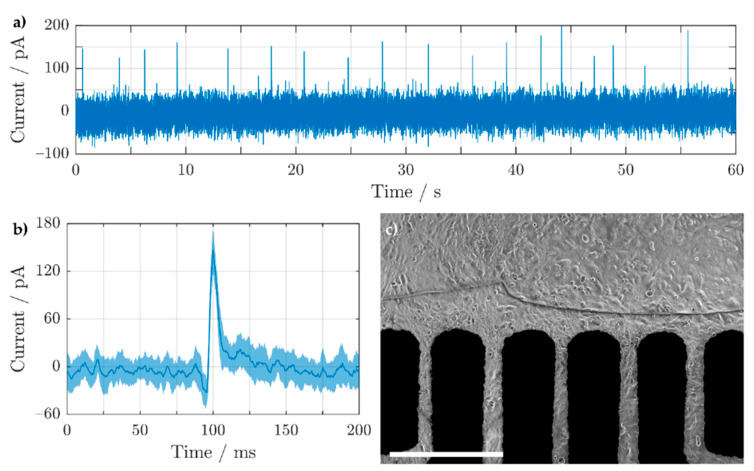
Figure 9.
(a) Extracellular potential recording of HL-1 cells on a Ag-Au-Pt 3D MEA recorded using an in-house-built amplifier. (b) The mean and standard deviation (solid line and shaded area, respectively) of the extracellular potentials are displayed in (a). (c) Optical image of the confluent HL-1 cells taken from the backside of the MEA using an inverted microscope (5× objective), with a 500 μm scale bar.

