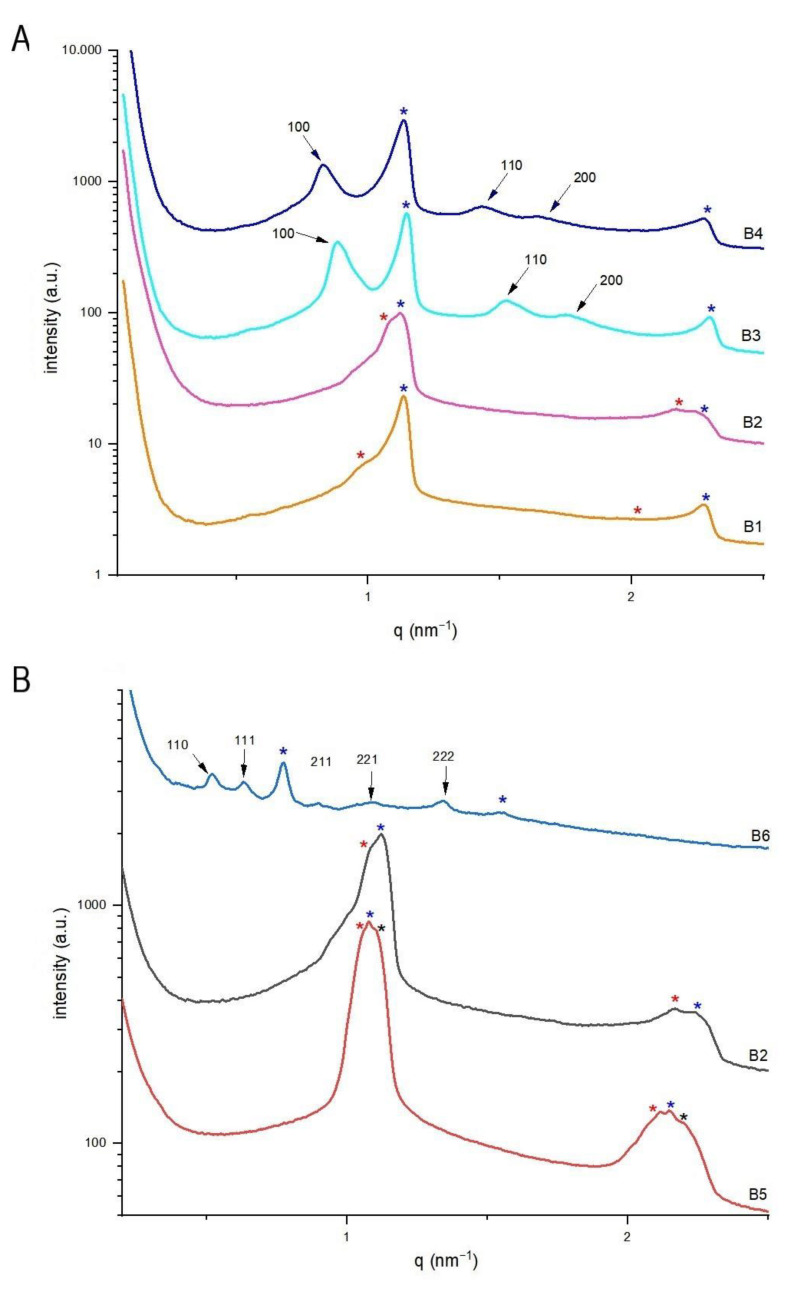
Figure 3.
Effects of TQ and ethanol concentrations at 25 °C on the structural features of citrem/SPC nanodispersions prepared using the low energy-emulsification batch method. (A) SAXS patterns of samples prepared at TQ concentrations in the range of 1–10 mg/mL. The nanodispersions (B1–B4) were prepared at citrem/SPC weight ratio of 2:3 and constant EtOH and lipid (SPC plus citrem) concentrations of 1.09 and 8.0 wt%, respectively. (B) SAXS patterns of 2:3 citrem/SPC nanodispersions prepared at a constant TQ concentration of 2.5 mg/mL and contained different concentrations of ethanol (in the range of 0–5.45 wt%, Table 2). The detected Bragg peaks and corresponding Miller indices for the inverse bicontinuous cubic Pn3m (A) and inverse hexagonal (H2) phases (B) are presented and marked with arrows. In panels A and B, the detected two characteristic peaks for the two coexisting Lα(1) and Lα(2) phases are marked with red and blue asterisks, respectively. The two characteristic peaks of the coexisting third lamellar phase (Lα(3) phase) detected in sample B5 is marked with black asterisks.

