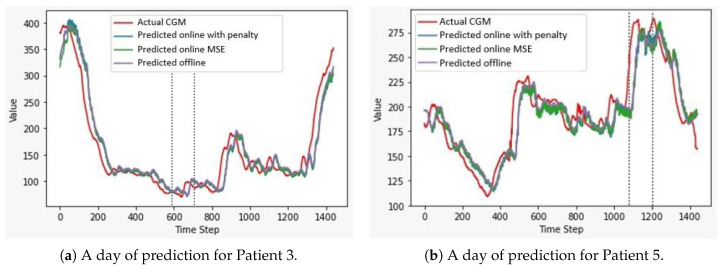
Figure 4.
Comparison between the predictions of the three configurations on two sample days. We report the actual CGM track (red line), the predictions of the online configuration with penalty (blue line), the predictions of the online configuration trained using the Mean-Squared-Error as a loss function (green line), and the predictions of the offline model (purple line). All the predictions are almost overlapped and slightly shifted from the original CGM values. The black dotted lines delimit the period during which physical activity was performed. (a) Predictions on a whole day of Patient 3, who performed anaerobic exercise (RMSEs between 24.2 and 26.0 mg/dL). (b) Predictions on a whole day of Patient 5, who performed aerobic exercise (RMSEs between 27.8 and 29.7 mg/dL).

