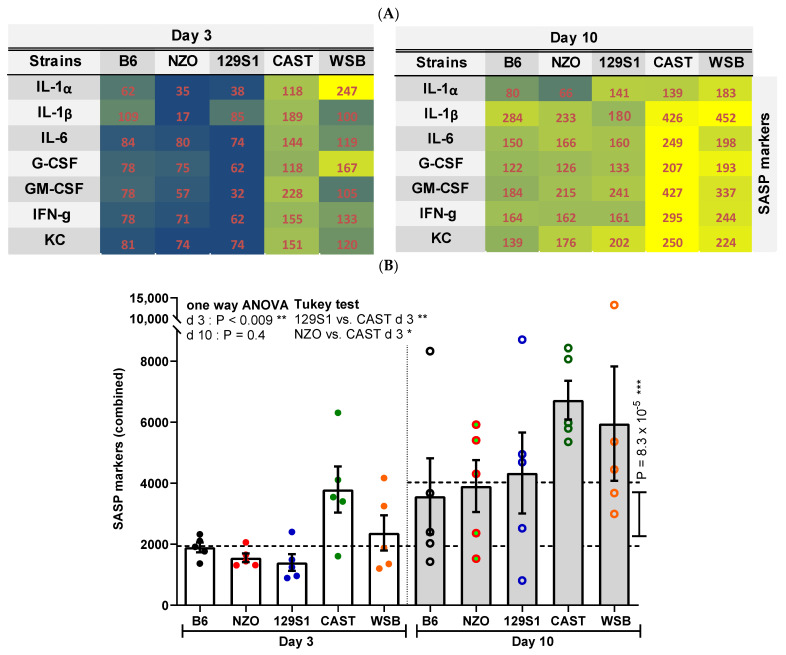
Figure 5.
Analysis of cellular senescence using senescence associated secretory phenotype (SASP). (A) Protein levels of the indicated seven SASP factors are visualized by heatmap for days 3 and 10 after irradiation. Mean values of the seven SASP factors are depicted for each mouse strain (average normalized to day 3) to define the overall levels of SASP secretion (signal intensities ranked from lowest = blue to highest = bright yellow). (B). Corresponding results are presented as means ± SEM (n= 5 mice for each strain). Significance between means of strains and means of time points were tested by the one-way ANOVA and t-test, respectively. Tukey’s test was performed as a post-hoc analysis in the case of multiple comparisons. Results from days 3 and 10 are tested separately. * p < 0.05; ** p < 0.01; *** p < 0.001.

