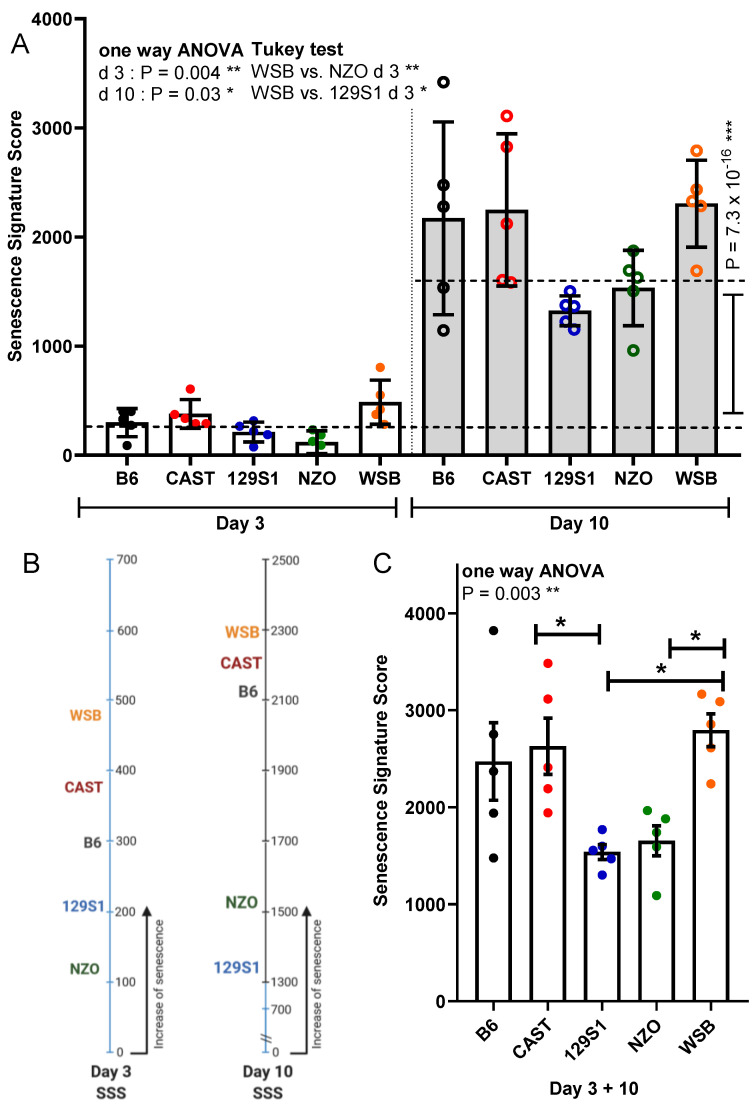
Figure 6.
Senescence signature score combining all markers. (A) A senescence signature score composed of all five markers (SA-β-gal, γ-H2AX+/Ki67−, Cdkn2a, and Lmnb1 expression, SASP) was calculated for each mouse and categorized by strain to define the overall levels of SASP secretion for days 3 and 10 after irradiation. (B) Mean of senescence signature score (SSS) for each strain. (C) Combined sum of SSS for days 3 and 10. Results are presented as means ± SEM (n = 5 mice for each strain). Significance between means of strains and means of time points were tested by the one-way ANOVA and t-test, respectively. Tukey’s test was performed as a post-hoc analysis in the case of multiple comparisons. Results from days 3 and 10 are tested separately. * p < 0.05; ** p < 0.01; *** p < 0.001.

