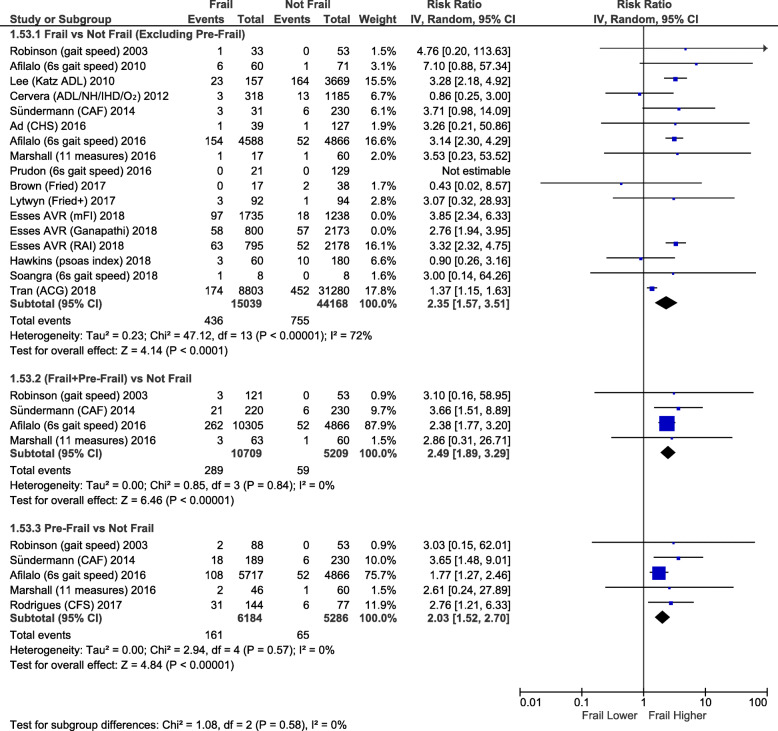
Fig. 1.
Forest Plot for unadjusted operative mortality. Individual study and pooled unadjusted risk ratios (RRs) of frail vs non-frail patients undergoing primarily CABG and valve surgery. The pooled RR and OR with 95% CI were calculated using random-effects models. Esses et al. [22] provided (unadjusted) results using three different frailty indices: modified frailty index (mFI), Ganapathi index, and risk analysis index (RAI). All three results are shown in the unadjusted figure but only the RAI results were used to calculate the pooled results in the figure. The pooled results are similar if the modified frailty index (RR 2.38, 95% CI 1.57 to 3.62, p < 0.0001; I2 = 72%) or Ganapathi index (RR2.28, 95%CI:1.56–3.35, p < 0.0001; I2 = 69%) are used. Sensitivity analyses – Unadjusted risk of operative mortality also higher if the two studies with largest weighting ([14, 24]) are excluded: RR2.99, 95%CI:2.34–3.82, p < 0.00001, I2 = 0% (the unadjusted risk of operative mortality remains higher if the next two largest weightings are also excluded ([6, 22]): RR1.85, 95%CI:1.02–3.34, p = 0.04, I2 = 0%)

