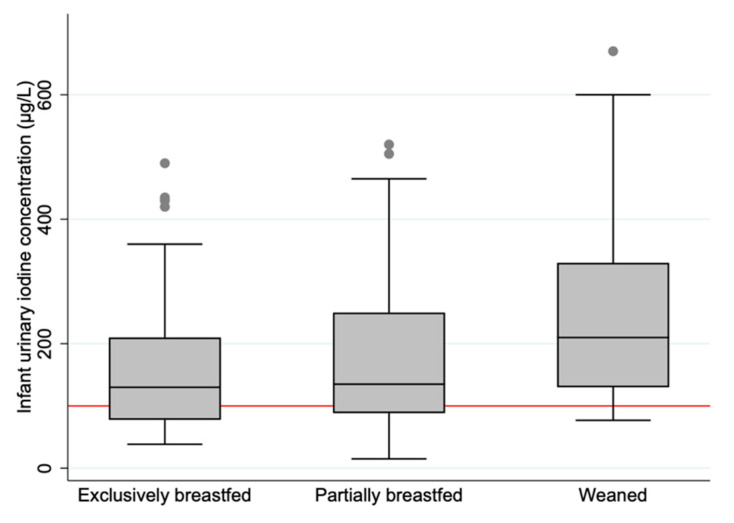
Figure 2.
Boxplot displaying infant urinary iodine concentration (µg/L) in the three categories of breastfeeding status. The horizontal black line indicates the median; the boxes indicate the interquartile range (IQR); the whiskers represent observations within 1.5 times the IQR. The red line shows the recommended median value for sufficient iodine concentration in urine (≥100 µg/L).

