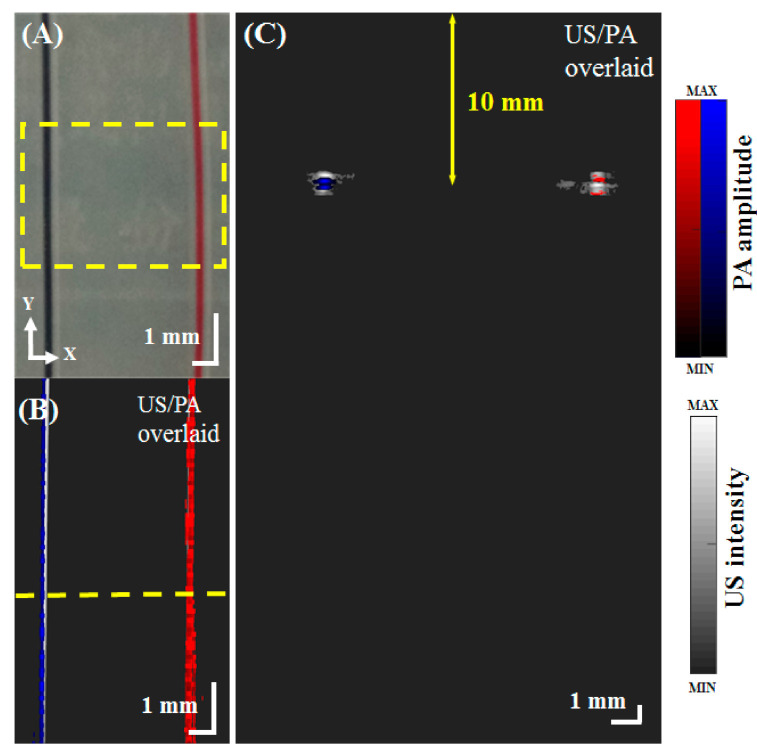
Figure 2.
US/PA images of vessel phantoms. (A) Image of the tube phantoms filled with red and blue ink to mimic oxygenated and deoxygenated blood. The phantoms were imaged using US/PA within the yellow dashed rectangle (3 mm × 6 mm). (B) Overlaid US/PA MAP image (PA850/PA750) of the tube phantoms filled with red and blue ink. The yellow dashed line marks the location of the cross-sectional US/PA B-scan shown in Figure 2C. (C) Overlaid US/PA B-scan image of the phantoms at an imaging depth of 10 mm. PA, photoacoustic; US, ultrasound; PA750, PA signal at an excitation wavelength of 750 nm; PA850, PA signal at an excitation wavelength of 850 nm; and MAP, maximum amplitude projection.

