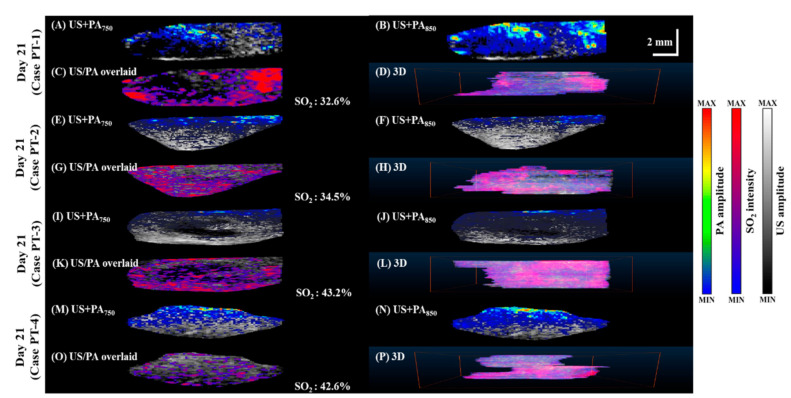
Figure 7.
Relative SO2 levels in pancreatic tumor in mice imaged 21 days after tumor cell injection. (A,E,I,M) PA images acquired at 750 nm overlaid with grayscale US B-mode images. (B,F,J,N) PA images acquired at 850 nm overlaid with grayscale US B-mode images. (C,G,K,O) SO2 was calculated as the percentage of oxygenated hemoglobin relative to total hemoglobin based on dual-wavelength PA imaging at 750 and 850 nm and overlaid with grayscale US B-scan images. (D,H,L,P) C-scan of SO2 dynamics. Rotational 3D images can be seen in Supplementary Materials Video S3.

