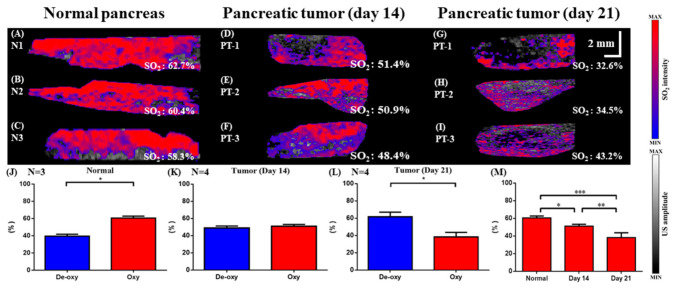
Figure 8.
Comparison of the relative SO2 levels in the pancreas of normal and tumor-bearing mice on day 14 and day 21. (A–C) Representative images of SO2 levels in normal mice. (D–F) Representative images of SO2 levels in tumor-bearing mice on day 14 after the tumor cell injection and on day 21 (G–I). (J) Quantification of the levels of deoxy vs. oxyhemoglobin in normal and tumor-bearing mice on day 14 (K) and day 21 (L). (M) Comparison of tissue SO2 in normal, day 14, and day 21 tumors (* p < 0.05, ** p < 0.01, *** p < 0.001).

