Figure 11.
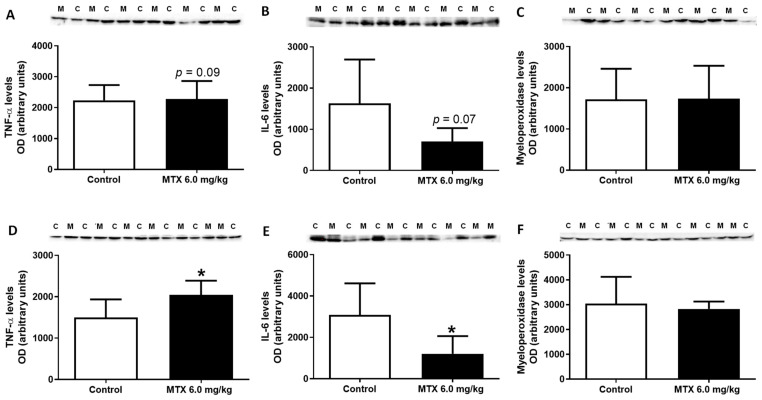
Tumour necrosis factor-α (TNF- α) (25 kDa), interleukin-6 (IL-6) (24 kDa), myeloperoxidase (48 kDa) expression evaluated by western blotting, from (A–C) infant MTX-treated (M) and control (C) mice, and (D–F) adult mice exposed to a cumulative dose of 6.0 mg/kg MTX (M) and respective controls (C) (experiment 2, infant and adult mice euthanized 17 or 7 days after the last administration, respectively). Values are expressed as mean ± SD and were obtained from 6 (infant) and 6–7 (adult) animals from each treatment group. Statistical comparisons were made using the t-test: * p < 0.05, MTX 6.0 mg/kg vs. control. OD: optic density. Protein loading was confirmed by the Ponceau S staining (Figures S3 and S4).

