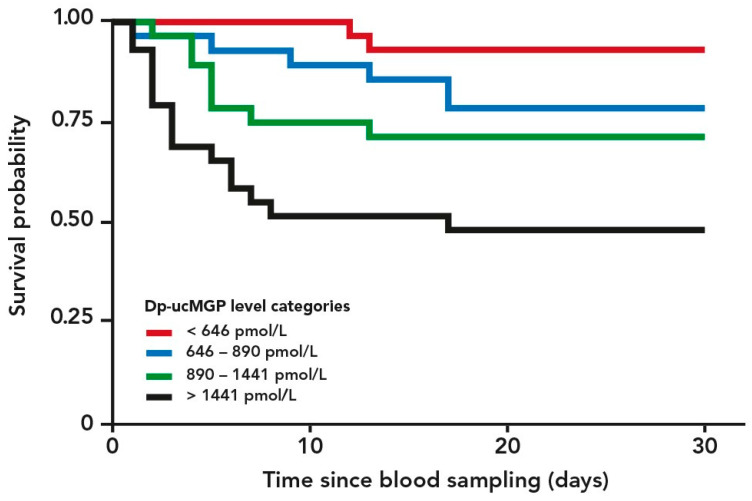
Figure 2.
Kaplan–Meier plot of 90-day cumulated risk of dying versus time from blood drawing stratified by levels of dephosphorylated uncarboxylated Matrix Gla Protein (dp-ucMGP) categories (quartiles of dp-ucMGP). High levels of dp-ucMGP reflect low vitamin K status. p-value for log-rank test for comparison of the groups was <0.0001.

