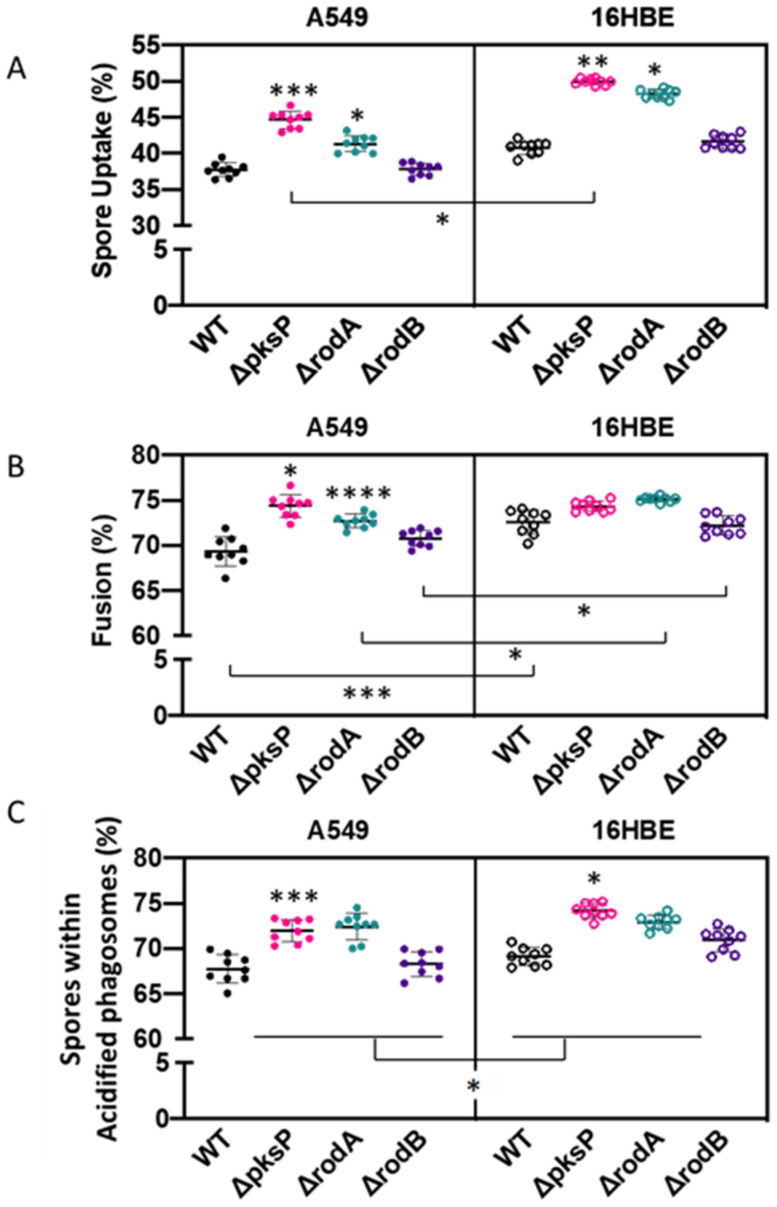
Figure 6.
Impact of A. fumigatus cell wall mutants in (A) spore uptake, (B) phagolysosome fusion and (C) phagosome acidification of A549 and 16HBE airway epithelial cells at 3 h post-infection. Asterisks represent differences vs. wild type for each mutant within cell lines. Lines represent differences between cell lines for each mutant. Data shown as mean ± standard deviation of three biological replicates assayed in technical triplicates (* p < 0.05, ** p < 0.01, *** p < 0.001, **** p < 0.0001).

