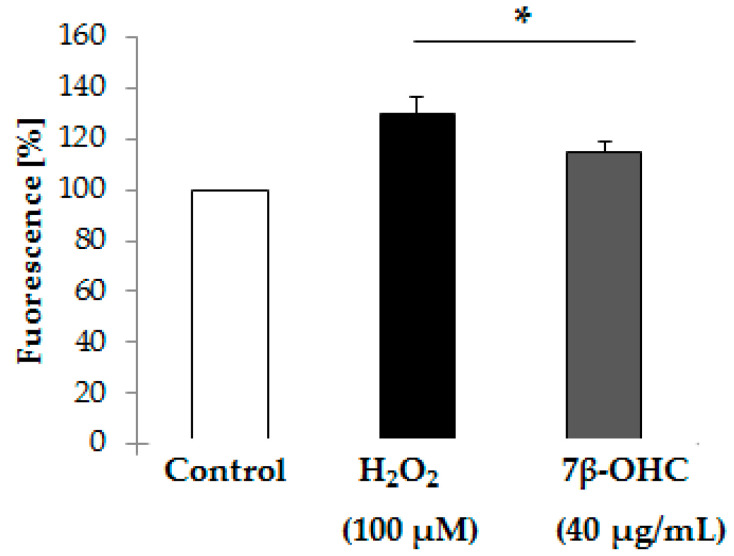
Figure 3.
Effect of 7β-OHC on Intracellular ROS production by H2DCFDA fluorescence assay. Data are represented as mean ± SD. ROS: reactive oxygen species; H2DCFDA: 2′7′-dichlorofluorescein diacetate; DCF: 2′7′-dichlorofluorescein; 7β-OHC: 7β-hydroxycholesterol; H2O2: Hydrogen peroxide. Statistical analyses were performed using the Mann–Whitney test or student t test. * Statistical differences were significant between the control and 7β-OHC or H2O2-treated cells (p < 0.05).

